Scotch-Irish vs Yugoslavian Poverty
COMPARE
Scotch-Irish
Yugoslavian
Poverty
Poverty Comparison
Scotch-Irish
Yugoslavians
12.2%
POVERTY
62.6/ 100
METRIC RATING
156th/ 347
METRIC RANK
11.8%
POVERTY
85.2/ 100
METRIC RATING
134th/ 347
METRIC RANK
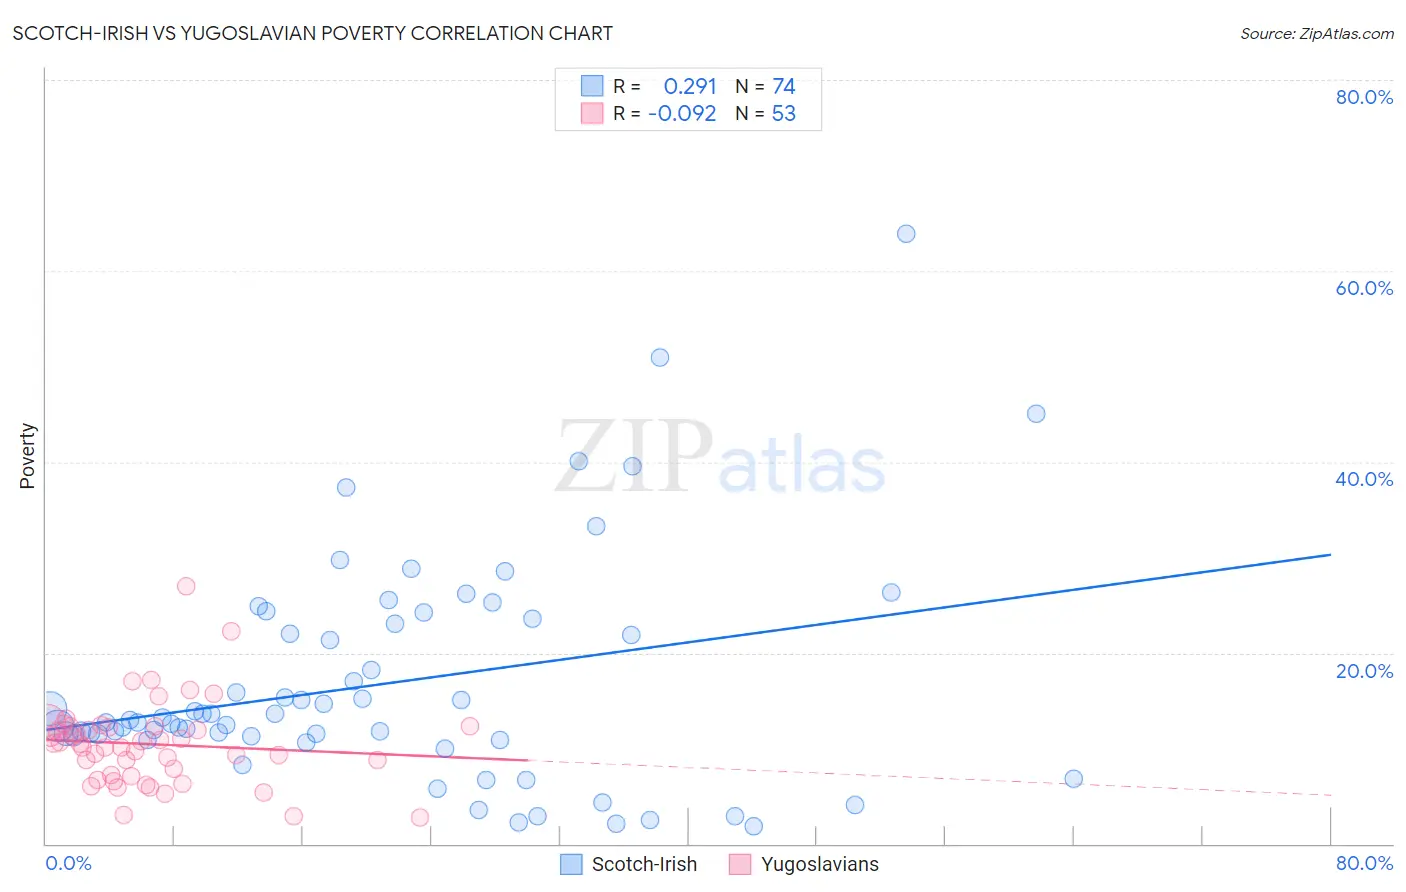
Scotch-Irish vs Yugoslavian Poverty Correlation Chart
The statistical analysis conducted on geographies consisting of 548,217,294 people shows a weak positive correlation between the proportion of Scotch-Irish and poverty level in the United States with a correlation coefficient (R) of 0.291 and weighted average of 12.2%. Similarly, the statistical analysis conducted on geographies consisting of 285,571,582 people shows a slight negative correlation between the proportion of Yugoslavians and poverty level in the United States with a correlation coefficient (R) of -0.092 and weighted average of 11.8%, a difference of 3.1%.
Poverty Correlation Summary
| Measurement | Scotch-Irish | Yugoslavian |
| Minimum | 1.8% | 2.7% |
| Maximum | 63.9% | 27.0% |
| Range | 62.1% | 24.3% |
| Mean | 16.7% | 10.4% |
| Median | 12.9% | 10.5% |
| Interquartile 25% (IQ1) | 11.3% | 7.1% |
| Interquartile 75% (IQ3) | 23.0% | 12.3% |
| Interquartile Range (IQR) | 11.7% | 5.2% |
| Standard Deviation (Sample) | 11.7% | 4.4% |
| Standard Deviation (Population) | 11.6% | 4.4% |
Similar Demographics by Poverty
Demographics Similar to Scotch-Irish by Poverty
In terms of poverty, the demographic groups most similar to Scotch-Irish are Costa Rican (12.2%, a difference of 0.040%), Taiwanese (12.2%, a difference of 0.080%), Hungarian (12.2%, a difference of 0.11%), Guamanian/Chamorro (12.1%, a difference of 0.14%), and Immigrants from Northern Africa (12.1%, a difference of 0.15%).
| Demographics | Rating | Rank | Poverty |
| Immigrants | Malaysia | 72.7 /100 | #149 | Good 12.0% |
| Immigrants | Kazakhstan | 72.3 /100 | #150 | Good 12.0% |
| Samoans | 71.9 /100 | #151 | Good 12.0% |
| Armenians | 67.6 /100 | #152 | Good 12.1% |
| Immigrants | Northern Africa | 63.9 /100 | #153 | Good 12.1% |
| Guamanians/Chamorros | 63.9 /100 | #154 | Good 12.1% |
| Hungarians | 63.6 /100 | #155 | Good 12.2% |
| Scotch-Irish | 62.6 /100 | #156 | Good 12.2% |
| Costa Ricans | 62.2 /100 | #157 | Good 12.2% |
| Taiwanese | 61.8 /100 | #158 | Good 12.2% |
| Pennsylvania Germans | 60.8 /100 | #159 | Good 12.2% |
| Immigrants | Nepal | 60.4 /100 | #160 | Good 12.2% |
| Immigrants | Fiji | 59.1 /100 | #161 | Average 12.2% |
| Ethiopians | 59.1 /100 | #162 | Average 12.2% |
| Immigrants | Ethiopia | 58.6 /100 | #163 | Average 12.2% |
Demographics Similar to Yugoslavians by Poverty
In terms of poverty, the demographic groups most similar to Yugoslavians are Immigrants from Western Europe (11.8%, a difference of 0.010%), Immigrants from Vietnam (11.8%, a difference of 0.010%), Peruvian (11.8%, a difference of 0.080%), French (11.8%, a difference of 0.19%), and Chilean (11.8%, a difference of 0.20%).
| Demographics | Rating | Rank | Poverty |
| Immigrants | Argentina | 88.0 /100 | #127 | Excellent 11.7% |
| Immigrants | Israel | 87.4 /100 | #128 | Excellent 11.7% |
| South Africans | 87.0 /100 | #129 | Excellent 11.7% |
| Immigrants | Ukraine | 86.6 /100 | #130 | Excellent 11.8% |
| French | 86.1 /100 | #131 | Excellent 11.8% |
| Peruvians | 85.6 /100 | #132 | Excellent 11.8% |
| Immigrants | Western Europe | 85.2 /100 | #133 | Excellent 11.8% |
| Yugoslavians | 85.2 /100 | #134 | Excellent 11.8% |
| Immigrants | Vietnam | 85.2 /100 | #135 | Excellent 11.8% |
| Chileans | 84.2 /100 | #136 | Excellent 11.8% |
| Immigrants | Switzerland | 83.0 /100 | #137 | Excellent 11.8% |
| Immigrants | Jordan | 82.4 /100 | #138 | Excellent 11.9% |
| Pakistanis | 82.2 /100 | #139 | Excellent 11.9% |
| Immigrants | Peru | 81.1 /100 | #140 | Excellent 11.9% |
| Immigrants | France | 80.5 /100 | #141 | Excellent 11.9% |