Scandinavian vs Immigrants from Micronesia Married-Couple Family Poverty
COMPARE
Scandinavian
Immigrants from Micronesia
Married-Couple Family Poverty
Married-Couple Family Poverty Comparison
Scandinavians
Immigrants from Micronesia
4.1%
MARRIED-COUPLE FAMILY POVERTY
99.9/ 100
METRIC RATING
28th/ 347
METRIC RANK
5.5%
MARRIED-COUPLE FAMILY POVERTY
14.4/ 100
METRIC RATING
210th/ 347
METRIC RANK
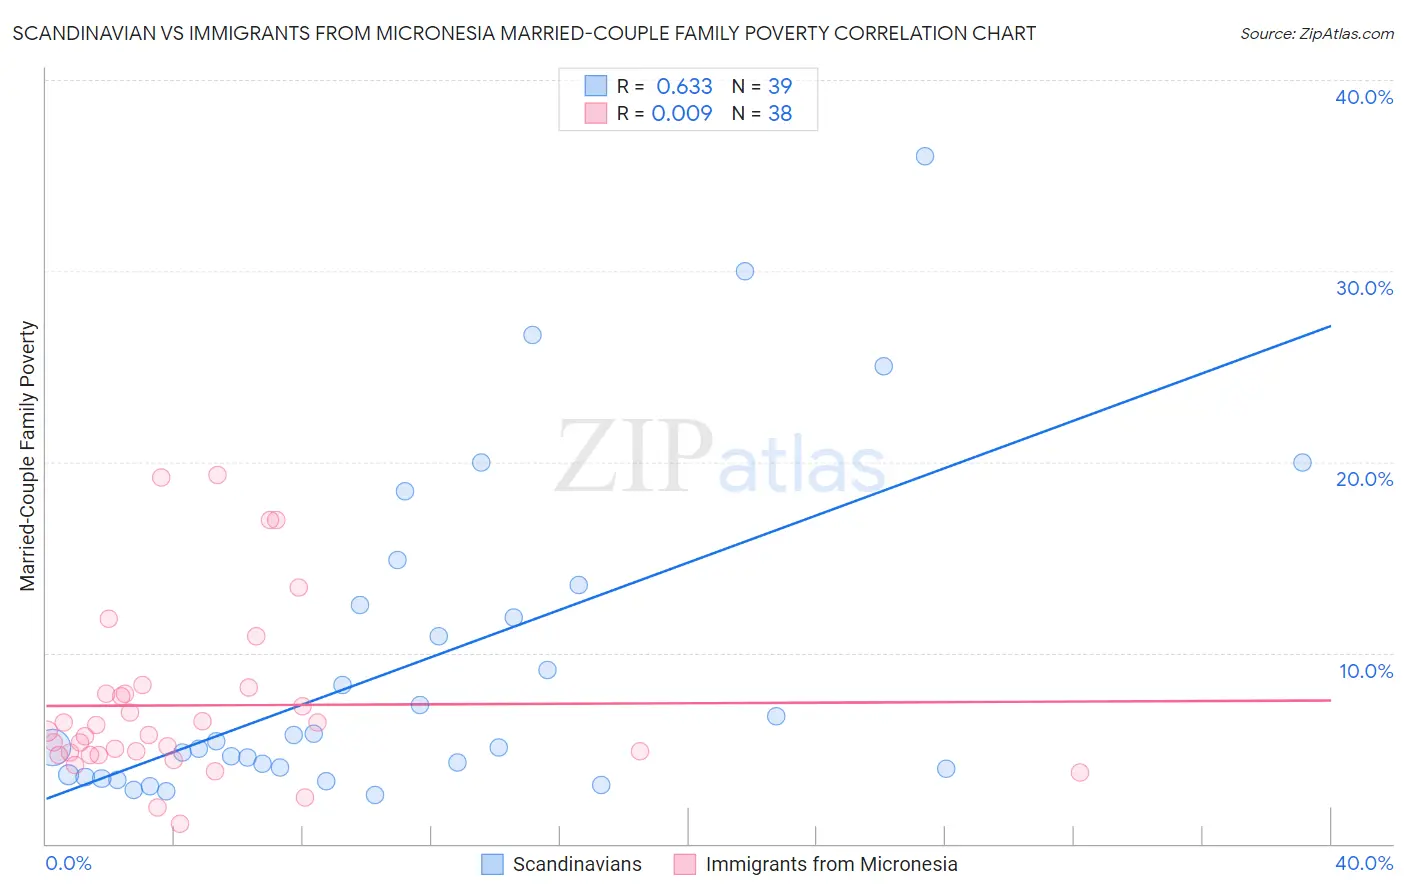
Scandinavian vs Immigrants from Micronesia Married-Couple Family Poverty Correlation Chart
The statistical analysis conducted on geographies consisting of 465,332,033 people shows a significant positive correlation between the proportion of Scandinavians and poverty level among married-couple families in the United States with a correlation coefficient (R) of 0.633 and weighted average of 4.1%. Similarly, the statistical analysis conducted on geographies consisting of 61,488,987 people shows no correlation between the proportion of Immigrants from Micronesia and poverty level among married-couple families in the United States with a correlation coefficient (R) of 0.009 and weighted average of 5.5%, a difference of 32.3%.
Married-Couple Family Poverty Correlation Summary
| Measurement | Scandinavian | Immigrants from Micronesia |
| Minimum | 2.5% | 1.0% |
| Maximum | 36.0% | 19.3% |
| Range | 33.5% | 18.3% |
| Mean | 9.3% | 7.2% |
| Median | 5.1% | 5.8% |
| Interquartile 25% (IQ1) | 3.6% | 4.7% |
| Interquartile 75% (IQ3) | 12.5% | 7.8% |
| Interquartile Range (IQR) | 8.9% | 3.2% |
| Standard Deviation (Sample) | 8.5% | 4.5% |
| Standard Deviation (Population) | 8.4% | 4.4% |
Similar Demographics by Married-Couple Family Poverty
Demographics Similar to Scandinavians by Married-Couple Family Poverty
In terms of married-couple family poverty, the demographic groups most similar to Scandinavians are Immigrants from Scotland (4.2%, a difference of 0.040%), Danish (4.1%, a difference of 0.11%), Cypriot (4.1%, a difference of 0.22%), Finnish (4.2%, a difference of 0.28%), and Estonian (4.2%, a difference of 0.36%).
| Demographics | Rating | Rank | Married-Couple Family Poverty |
| Zimbabweans | 99.9 /100 | #21 | Exceptional 4.1% |
| Immigrants | Singapore | 99.9 /100 | #22 | Exceptional 4.1% |
| Bhutanese | 99.9 /100 | #23 | Exceptional 4.1% |
| Eastern Europeans | 99.9 /100 | #24 | Exceptional 4.1% |
| Immigrants | Taiwan | 99.9 /100 | #25 | Exceptional 4.1% |
| Cypriots | 99.9 /100 | #26 | Exceptional 4.1% |
| Danes | 99.9 /100 | #27 | Exceptional 4.1% |
| Scandinavians | 99.9 /100 | #28 | Exceptional 4.1% |
| Immigrants | Scotland | 99.9 /100 | #29 | Exceptional 4.2% |
| Finns | 99.9 /100 | #30 | Exceptional 4.2% |
| Estonians | 99.9 /100 | #31 | Exceptional 4.2% |
| Greeks | 99.9 /100 | #32 | Exceptional 4.2% |
| Irish | 99.9 /100 | #33 | Exceptional 4.2% |
| Dutch | 99.9 /100 | #34 | Exceptional 4.2% |
| Europeans | 99.9 /100 | #35 | Exceptional 4.2% |
Demographics Similar to Immigrants from Micronesia by Married-Couple Family Poverty
In terms of married-couple family poverty, the demographic groups most similar to Immigrants from Micronesia are Nigerian (5.5%, a difference of 0.020%), Immigrants from Thailand (5.5%, a difference of 0.090%), Immigrants from Syria (5.5%, a difference of 0.21%), Immigrants from Liberia (5.5%, a difference of 0.26%), and Iroquois (5.5%, a difference of 0.31%).
| Demographics | Rating | Rank | Married-Couple Family Poverty |
| Immigrants | Peru | 21.8 /100 | #203 | Fair 5.4% |
| Immigrants | Costa Rica | 19.4 /100 | #204 | Poor 5.4% |
| Chippewa | 18.9 /100 | #205 | Poor 5.4% |
| Osage | 18.4 /100 | #206 | Poor 5.4% |
| Immigrants | Africa | 17.6 /100 | #207 | Poor 5.5% |
| French American Indians | 16.1 /100 | #208 | Poor 5.5% |
| Immigrants | Syria | 15.4 /100 | #209 | Poor 5.5% |
| Immigrants | Micronesia | 14.4 /100 | #210 | Poor 5.5% |
| Nigerians | 14.3 /100 | #211 | Poor 5.5% |
| Immigrants | Thailand | 14.0 /100 | #212 | Poor 5.5% |
| Immigrants | Liberia | 13.3 /100 | #213 | Poor 5.5% |
| Iroquois | 13.1 /100 | #214 | Poor 5.5% |
| Armenians | 12.8 /100 | #215 | Poor 5.5% |
| Potawatomi | 12.4 /100 | #216 | Poor 5.5% |
| Immigrants | Nigeria | 11.3 /100 | #217 | Poor 5.5% |