U.S. Virgin Islander vs Immigrants from Micronesia Married-Couple Family Poverty
COMPARE
U.S. Virgin Islander
Immigrants from Micronesia
Married-Couple Family Poverty
Married-Couple Family Poverty Comparison
U.S. Virgin Islanders
Immigrants from Micronesia
6.6%
MARRIED-COUPLE FAMILY POVERTY
0.0/ 100
METRIC RATING
296th/ 347
METRIC RANK
5.5%
MARRIED-COUPLE FAMILY POVERTY
14.4/ 100
METRIC RATING
210th/ 347
METRIC RANK
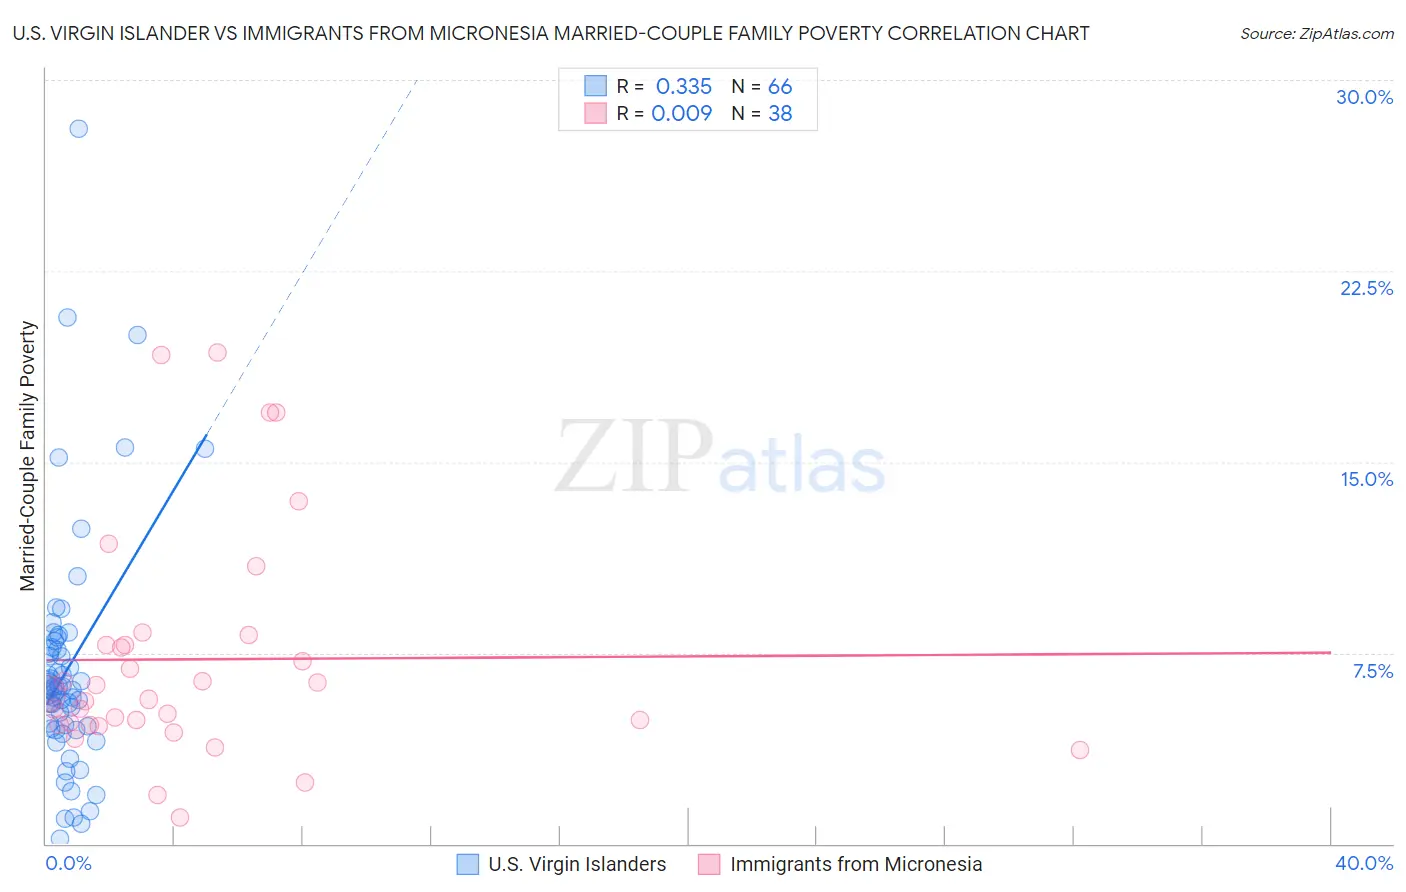
U.S. Virgin Islander vs Immigrants from Micronesia Married-Couple Family Poverty Correlation Chart
The statistical analysis conducted on geographies consisting of 87,431,067 people shows a mild positive correlation between the proportion of U.S. Virgin Islanders and poverty level among married-couple families in the United States with a correlation coefficient (R) of 0.335 and weighted average of 6.6%. Similarly, the statistical analysis conducted on geographies consisting of 61,488,987 people shows no correlation between the proportion of Immigrants from Micronesia and poverty level among married-couple families in the United States with a correlation coefficient (R) of 0.009 and weighted average of 5.5%, a difference of 21.1%.
Married-Couple Family Poverty Correlation Summary
| Measurement | U.S. Virgin Islander | Immigrants from Micronesia |
| Minimum | 0.18% | 1.0% |
| Maximum | 28.1% | 19.3% |
| Range | 27.9% | 18.3% |
| Mean | 6.9% | 7.2% |
| Median | 6.1% | 5.8% |
| Interquartile 25% (IQ1) | 4.5% | 4.7% |
| Interquartile 75% (IQ3) | 7.7% | 7.8% |
| Interquartile Range (IQR) | 3.2% | 3.2% |
| Standard Deviation (Sample) | 4.8% | 4.5% |
| Standard Deviation (Population) | 4.7% | 4.4% |
Similar Demographics by Married-Couple Family Poverty
Demographics Similar to U.S. Virgin Islanders by Married-Couple Family Poverty
In terms of married-couple family poverty, the demographic groups most similar to U.S. Virgin Islanders are Kiowa (6.6%, a difference of 0.010%), Immigrants from Guyana (6.7%, a difference of 0.070%), Immigrants from Uzbekistan (6.6%, a difference of 0.10%), Bahamian (6.6%, a difference of 0.39%), and Nicaraguan (6.7%, a difference of 0.62%).
| Demographics | Rating | Rank | Married-Couple Family Poverty |
| Nepalese | 0.0 /100 | #289 | Tragic 6.5% |
| Immigrants | Barbados | 0.0 /100 | #290 | Tragic 6.5% |
| Belizeans | 0.0 /100 | #291 | Tragic 6.5% |
| Immigrants | Lebanon | 0.0 /100 | #292 | Tragic 6.6% |
| Arapaho | 0.0 /100 | #293 | Tragic 6.6% |
| Bahamians | 0.0 /100 | #294 | Tragic 6.6% |
| Immigrants | Uzbekistan | 0.0 /100 | #295 | Tragic 6.6% |
| U.S. Virgin Islanders | 0.0 /100 | #296 | Tragic 6.6% |
| Kiowa | 0.0 /100 | #297 | Tragic 6.6% |
| Immigrants | Guyana | 0.0 /100 | #298 | Tragic 6.7% |
| Nicaraguans | 0.0 /100 | #299 | Tragic 6.7% |
| Immigrants | Belize | 0.0 /100 | #300 | Tragic 6.7% |
| Central Americans | 0.0 /100 | #301 | Tragic 6.7% |
| Immigrants | Ecuador | 0.0 /100 | #302 | Tragic 6.7% |
| Immigrants | El Salvador | 0.0 /100 | #303 | Tragic 6.8% |
Demographics Similar to Immigrants from Micronesia by Married-Couple Family Poverty
In terms of married-couple family poverty, the demographic groups most similar to Immigrants from Micronesia are Nigerian (5.5%, a difference of 0.020%), Immigrants from Thailand (5.5%, a difference of 0.090%), Immigrants from Syria (5.5%, a difference of 0.21%), Immigrants from Liberia (5.5%, a difference of 0.26%), and Iroquois (5.5%, a difference of 0.31%).
| Demographics | Rating | Rank | Married-Couple Family Poverty |
| Immigrants | Peru | 21.8 /100 | #203 | Fair 5.4% |
| Immigrants | Costa Rica | 19.4 /100 | #204 | Poor 5.4% |
| Chippewa | 18.9 /100 | #205 | Poor 5.4% |
| Osage | 18.4 /100 | #206 | Poor 5.4% |
| Immigrants | Africa | 17.6 /100 | #207 | Poor 5.5% |
| French American Indians | 16.1 /100 | #208 | Poor 5.5% |
| Immigrants | Syria | 15.4 /100 | #209 | Poor 5.5% |
| Immigrants | Micronesia | 14.4 /100 | #210 | Poor 5.5% |
| Nigerians | 14.3 /100 | #211 | Poor 5.5% |
| Immigrants | Thailand | 14.0 /100 | #212 | Poor 5.5% |
| Immigrants | Liberia | 13.3 /100 | #213 | Poor 5.5% |
| Iroquois | 13.1 /100 | #214 | Poor 5.5% |
| Armenians | 12.8 /100 | #215 | Poor 5.5% |
| Potawatomi | 12.4 /100 | #216 | Poor 5.5% |
| Immigrants | Nigeria | 11.3 /100 | #217 | Poor 5.5% |