Russian vs West Indian Married-Couple Family Poverty
COMPARE
Russian
West Indian
Married-Couple Family Poverty
Married-Couple Family Poverty Comparison
Russians
West Indians
4.3%
MARRIED-COUPLE FAMILY POVERTY
99.7/ 100
METRIC RATING
52nd/ 347
METRIC RANK
6.4%
MARRIED-COUPLE FAMILY POVERTY
0.0/ 100
METRIC RATING
280th/ 347
METRIC RANK
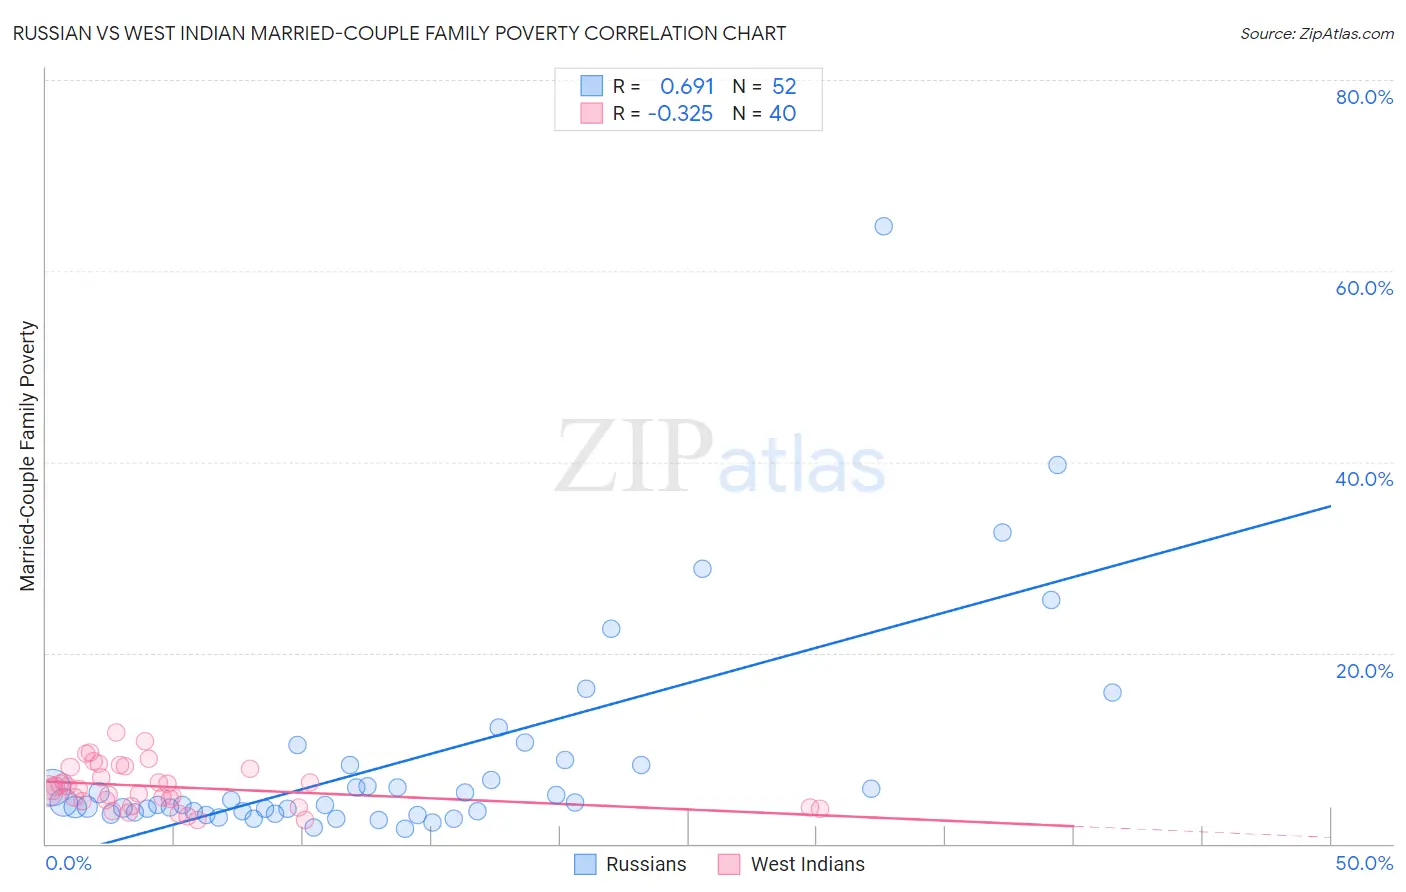
Russian vs West Indian Married-Couple Family Poverty Correlation Chart
The statistical analysis conducted on geographies consisting of 502,513,768 people shows a significant positive correlation between the proportion of Russians and poverty level among married-couple families in the United States with a correlation coefficient (R) of 0.691 and weighted average of 4.3%. Similarly, the statistical analysis conducted on geographies consisting of 252,794,442 people shows a mild negative correlation between the proportion of West Indians and poverty level among married-couple families in the United States with a correlation coefficient (R) of -0.325 and weighted average of 6.4%, a difference of 47.7%.
Married-Couple Family Poverty Correlation Summary
| Measurement | Russian | West Indian |
| Minimum | 1.6% | 2.5% |
| Maximum | 64.7% | 11.6% |
| Range | 63.1% | 9.1% |
| Mean | 8.7% | 6.0% |
| Median | 4.1% | 5.7% |
| Interquartile 25% (IQ1) | 3.3% | 4.2% |
| Interquartile 75% (IQ3) | 8.3% | 8.0% |
| Interquartile Range (IQR) | 5.0% | 3.8% |
| Standard Deviation (Sample) | 11.4% | 2.3% |
| Standard Deviation (Population) | 11.3% | 2.3% |
Similar Demographics by Married-Couple Family Poverty
Demographics Similar to Russians by Married-Couple Family Poverty
In terms of married-couple family poverty, the demographic groups most similar to Russians are Immigrants from Lithuania (4.3%, a difference of 0.030%), Burmese (4.3%, a difference of 0.040%), Turkish (4.3%, a difference of 0.13%), Welsh (4.3%, a difference of 0.15%), and Australian (4.3%, a difference of 0.21%).
| Demographics | Rating | Rank | Married-Couple Family Poverty |
| Serbians | 99.8 /100 | #45 | Exceptional 4.3% |
| British | 99.8 /100 | #46 | Exceptional 4.3% |
| Immigrants | South Central Asia | 99.8 /100 | #47 | Exceptional 4.3% |
| Australians | 99.7 /100 | #48 | Exceptional 4.3% |
| Turks | 99.7 /100 | #49 | Exceptional 4.3% |
| Burmese | 99.7 /100 | #50 | Exceptional 4.3% |
| Immigrants | Lithuania | 99.7 /100 | #51 | Exceptional 4.3% |
| Russians | 99.7 /100 | #52 | Exceptional 4.3% |
| Welsh | 99.7 /100 | #53 | Exceptional 4.3% |
| Austrians | 99.7 /100 | #54 | Exceptional 4.3% |
| French | 99.7 /100 | #55 | Exceptional 4.3% |
| Immigrants | Zimbabwe | 99.7 /100 | #56 | Exceptional 4.3% |
| Immigrants | Netherlands | 99.7 /100 | #57 | Exceptional 4.3% |
| Czechoslovakians | 99.7 /100 | #58 | Exceptional 4.4% |
| Immigrants | Sweden | 99.6 /100 | #59 | Exceptional 4.4% |
Demographics Similar to West Indians by Married-Couple Family Poverty
In terms of married-couple family poverty, the demographic groups most similar to West Indians are Houma (6.4%, a difference of 0.050%), Immigrants from Trinidad and Tobago (6.4%, a difference of 0.29%), Mexican American Indian (6.4%, a difference of 0.51%), Seminole (6.4%, a difference of 0.51%), and Indonesian (6.3%, a difference of 0.78%).
| Demographics | Rating | Rank | Married-Couple Family Poverty |
| Colville | 0.1 /100 | #273 | Tragic 6.3% |
| Barbadians | 0.1 /100 | #274 | Tragic 6.3% |
| Choctaw | 0.1 /100 | #275 | Tragic 6.3% |
| Yaqui | 0.1 /100 | #276 | Tragic 6.3% |
| Indonesians | 0.1 /100 | #277 | Tragic 6.3% |
| Immigrants | Trinidad and Tobago | 0.1 /100 | #278 | Tragic 6.4% |
| Houma | 0.0 /100 | #279 | Tragic 6.4% |
| West Indians | 0.0 /100 | #280 | Tragic 6.4% |
| Mexican American Indians | 0.0 /100 | #281 | Tragic 6.4% |
| Seminole | 0.0 /100 | #282 | Tragic 6.4% |
| Ute | 0.0 /100 | #283 | Tragic 6.4% |
| Dutch West Indians | 0.0 /100 | #284 | Tragic 6.4% |
| Blacks/African Americans | 0.0 /100 | #285 | Tragic 6.5% |
| Guyanese | 0.0 /100 | #286 | Tragic 6.5% |
| Ecuadorians | 0.0 /100 | #287 | Tragic 6.5% |