Russian vs West Indian 4 or more Vehicles in Household
COMPARE
Russian
West Indian
4 or more Vehicles in Household
4 or more Vehicles in Household Comparison
Russians
West Indians
6.0%
4 OR MORE VEHICLES IN HOUSEHOLD
10.3/ 100
METRIC RATING
220th/ 347
METRIC RANK
4.2%
4 OR MORE VEHICLES IN HOUSEHOLD
0.0/ 100
METRIC RATING
331st/ 347
METRIC RANK
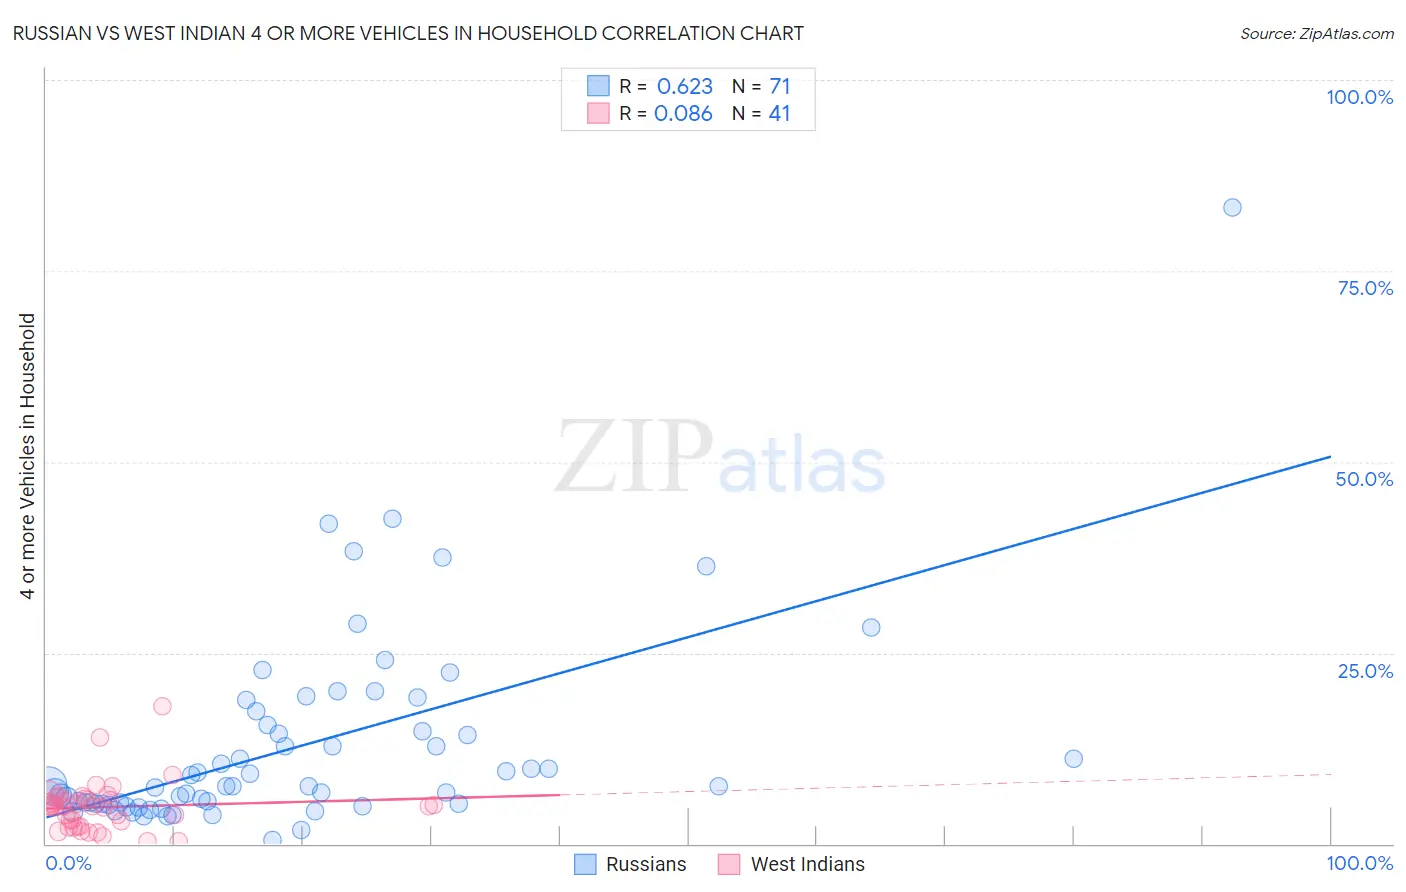
Russian vs West Indian 4 or more Vehicles in Household Correlation Chart
The statistical analysis conducted on geographies consisting of 509,368,397 people shows a significant positive correlation between the proportion of Russians and percentage of households with 4 or more vehicles available in the United States with a correlation coefficient (R) of 0.623 and weighted average of 6.0%. Similarly, the statistical analysis conducted on geographies consisting of 252,612,993 people shows a slight positive correlation between the proportion of West Indians and percentage of households with 4 or more vehicles available in the United States with a correlation coefficient (R) of 0.086 and weighted average of 4.2%, a difference of 41.6%.
4 or more Vehicles in Household Correlation Summary
| Measurement | Russian | West Indian |
| Minimum | 0.51% | 0.34% |
| Maximum | 83.3% | 17.9% |
| Range | 82.8% | 17.6% |
| Mean | 12.8% | 4.8% |
| Median | 7.5% | 4.9% |
| Interquartile 25% (IQ1) | 5.3% | 2.3% |
| Interquartile 75% (IQ3) | 15.6% | 6.0% |
| Interquartile Range (IQR) | 10.3% | 3.7% |
| Standard Deviation (Sample) | 13.0% | 3.3% |
| Standard Deviation (Population) | 12.9% | 3.3% |
Similar Demographics by 4 or more Vehicles in Household
Demographics Similar to Russians by 4 or more Vehicles in Household
In terms of 4 or more vehicles in household, the demographic groups most similar to Russians are Immigrants from Italy (6.0%, a difference of 0.19%), Serbian (6.0%, a difference of 0.19%), Immigrants from Moldova (6.0%, a difference of 0.29%), Cajun (6.0%, a difference of 0.33%), and Immigrants from Kenya (6.0%, a difference of 0.33%).
| Demographics | Rating | Rank | 4 or more Vehicles in Household |
| Arabs | 14.4 /100 | #213 | Poor 6.0% |
| Immigrants | Austria | 14.3 /100 | #214 | Poor 6.0% |
| Immigrants | China | 13.8 /100 | #215 | Poor 6.0% |
| Immigrants | Romania | 13.8 /100 | #216 | Poor 6.0% |
| Nigerians | 12.2 /100 | #217 | Poor 6.0% |
| Immigrants | Italy | 11.0 /100 | #218 | Poor 6.0% |
| Serbians | 11.0 /100 | #219 | Poor 6.0% |
| Russians | 10.3 /100 | #220 | Poor 6.0% |
| Immigrants | Moldova | 9.3 /100 | #221 | Tragic 6.0% |
| Cajuns | 9.2 /100 | #222 | Tragic 6.0% |
| Immigrants | Kenya | 9.2 /100 | #223 | Tragic 6.0% |
| Cubans | 9.2 /100 | #224 | Tragic 6.0% |
| Indonesians | 8.9 /100 | #225 | Tragic 6.0% |
| Immigrants | Singapore | 7.9 /100 | #226 | Tragic 5.9% |
| Immigrants | Western Asia | 7.8 /100 | #227 | Tragic 5.9% |
Demographics Similar to West Indians by 4 or more Vehicles in Household
In terms of 4 or more vehicles in household, the demographic groups most similar to West Indians are Immigrants from Ecuador (4.2%, a difference of 0.26%), Immigrants from Senegal (4.2%, a difference of 0.46%), Trinidadian and Tobagonian (4.3%, a difference of 0.73%), Immigrants from Dominica (4.2%, a difference of 0.90%), and Senegalese (4.3%, a difference of 2.3%).
| Demographics | Rating | Rank | 4 or more Vehicles in Household |
| Soviet Union | 0.0 /100 | #324 | Tragic 4.4% |
| Immigrants | Jamaica | 0.0 /100 | #325 | Tragic 4.4% |
| Cape Verdeans | 0.0 /100 | #326 | Tragic 4.4% |
| Senegalese | 0.0 /100 | #327 | Tragic 4.3% |
| Trinidadians and Tobagonians | 0.0 /100 | #328 | Tragic 4.3% |
| Immigrants | Senegal | 0.0 /100 | #329 | Tragic 4.2% |
| Immigrants | Ecuador | 0.0 /100 | #330 | Tragic 4.2% |
| West Indians | 0.0 /100 | #331 | Tragic 4.2% |
| Immigrants | Dominica | 0.0 /100 | #332 | Tragic 4.2% |
| Immigrants | Albania | 0.0 /100 | #333 | Tragic 4.1% |
| Immigrants | Trinidad and Tobago | 0.0 /100 | #334 | Tragic 4.1% |
| Barbadians | 0.0 /100 | #335 | Tragic 3.9% |
| Immigrants | Bangladesh | 0.0 /100 | #336 | Tragic 3.9% |
| Vietnamese | 0.0 /100 | #337 | Tragic 3.9% |
| Immigrants | Cabo Verde | 0.0 /100 | #338 | Tragic 3.8% |