Russian vs Asian Married-Couple Family Poverty
COMPARE
Russian
Asian
Married-Couple Family Poverty
Married-Couple Family Poverty Comparison
Russians
Asians
4.3%
MARRIED-COUPLE FAMILY POVERTY
99.7/ 100
METRIC RATING
52nd/ 347
METRIC RANK
4.7%
MARRIED-COUPLE FAMILY POVERTY
97.6/ 100
METRIC RATING
102nd/ 347
METRIC RANK
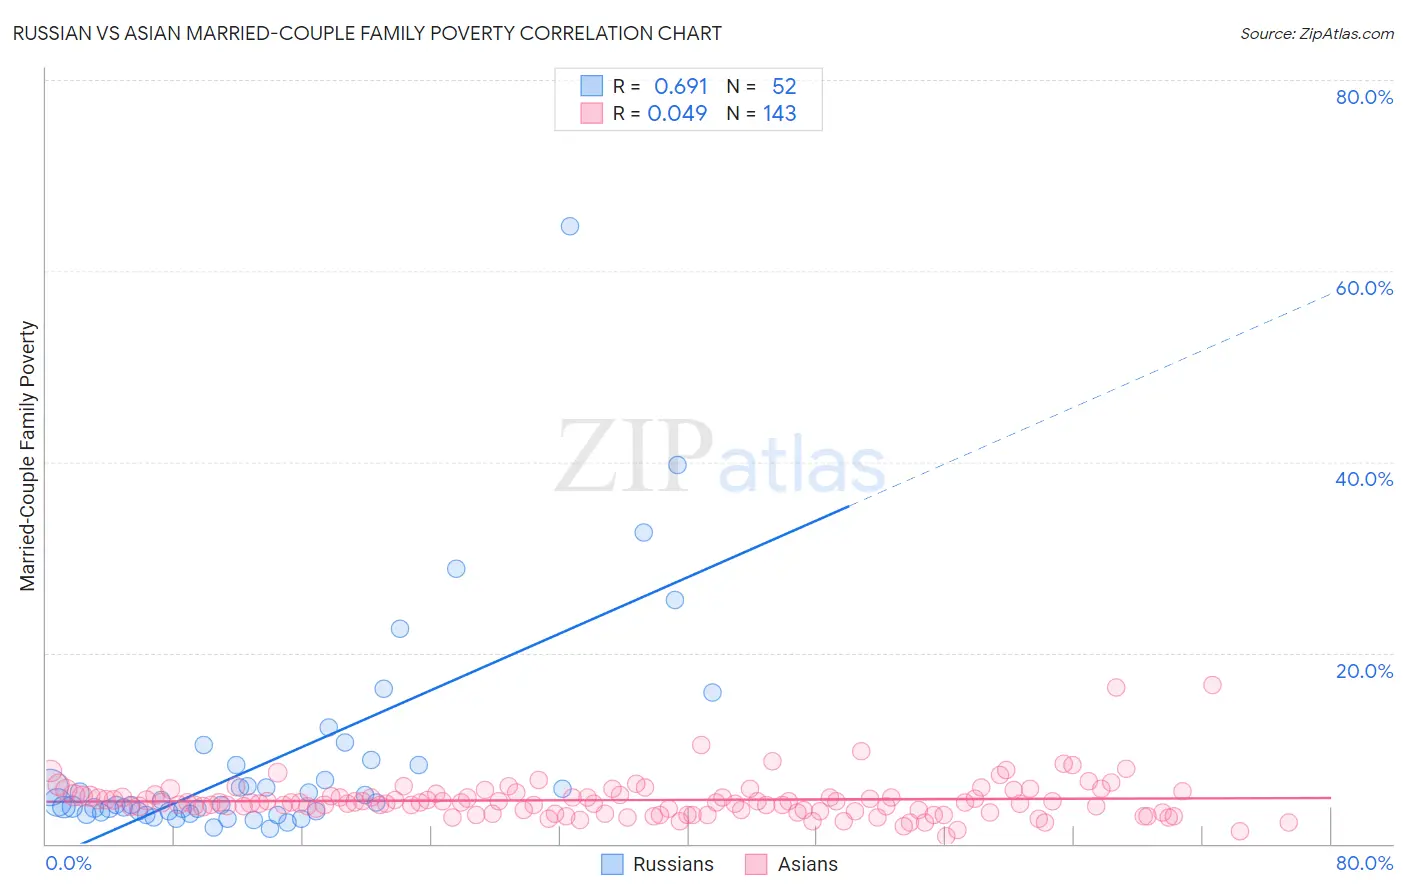
Russian vs Asian Married-Couple Family Poverty Correlation Chart
The statistical analysis conducted on geographies consisting of 502,513,768 people shows a significant positive correlation between the proportion of Russians and poverty level among married-couple families in the United States with a correlation coefficient (R) of 0.691 and weighted average of 4.3%. Similarly, the statistical analysis conducted on geographies consisting of 539,455,145 people shows no correlation between the proportion of Asians and poverty level among married-couple families in the United States with a correlation coefficient (R) of 0.049 and weighted average of 4.7%, a difference of 7.8%.
Married-Couple Family Poverty Correlation Summary
| Measurement | Russian | Asian |
| Minimum | 1.6% | 0.82% |
| Maximum | 64.7% | 16.6% |
| Range | 63.1% | 15.8% |
| Mean | 8.7% | 4.6% |
| Median | 4.1% | 4.3% |
| Interquartile 25% (IQ1) | 3.3% | 3.3% |
| Interquartile 75% (IQ3) | 8.3% | 5.1% |
| Interquartile Range (IQR) | 5.0% | 1.7% |
| Standard Deviation (Sample) | 11.4% | 2.1% |
| Standard Deviation (Population) | 11.3% | 2.1% |
Similar Demographics by Married-Couple Family Poverty
Demographics Similar to Russians by Married-Couple Family Poverty
In terms of married-couple family poverty, the demographic groups most similar to Russians are Immigrants from Lithuania (4.3%, a difference of 0.030%), Burmese (4.3%, a difference of 0.040%), Turkish (4.3%, a difference of 0.13%), Welsh (4.3%, a difference of 0.15%), and Australian (4.3%, a difference of 0.21%).
| Demographics | Rating | Rank | Married-Couple Family Poverty |
| Serbians | 99.8 /100 | #45 | Exceptional 4.3% |
| British | 99.8 /100 | #46 | Exceptional 4.3% |
| Immigrants | South Central Asia | 99.8 /100 | #47 | Exceptional 4.3% |
| Australians | 99.7 /100 | #48 | Exceptional 4.3% |
| Turks | 99.7 /100 | #49 | Exceptional 4.3% |
| Burmese | 99.7 /100 | #50 | Exceptional 4.3% |
| Immigrants | Lithuania | 99.7 /100 | #51 | Exceptional 4.3% |
| Russians | 99.7 /100 | #52 | Exceptional 4.3% |
| Welsh | 99.7 /100 | #53 | Exceptional 4.3% |
| Austrians | 99.7 /100 | #54 | Exceptional 4.3% |
| French | 99.7 /100 | #55 | Exceptional 4.3% |
| Immigrants | Zimbabwe | 99.7 /100 | #56 | Exceptional 4.3% |
| Immigrants | Netherlands | 99.7 /100 | #57 | Exceptional 4.3% |
| Czechoslovakians | 99.7 /100 | #58 | Exceptional 4.4% |
| Immigrants | Sweden | 99.6 /100 | #59 | Exceptional 4.4% |
Demographics Similar to Asians by Married-Couple Family Poverty
In terms of married-couple family poverty, the demographic groups most similar to Asians are Immigrants from Romania (4.7%, a difference of 0.29%), Yugoslavian (4.6%, a difference of 0.40%), Immigrants from Western Europe (4.6%, a difference of 0.42%), Immigrants from Europe (4.6%, a difference of 0.53%), and Immigrants from Moldova (4.7%, a difference of 0.63%).
| Demographics | Rating | Rank | Married-Couple Family Poverty |
| Portuguese | 98.3 /100 | #95 | Exceptional 4.6% |
| Immigrants | Poland | 98.3 /100 | #96 | Exceptional 4.6% |
| Immigrants | Belgium | 98.2 /100 | #97 | Exceptional 4.6% |
| Native Hawaiians | 98.0 /100 | #98 | Exceptional 4.6% |
| Immigrants | Europe | 97.9 /100 | #99 | Exceptional 4.6% |
| Immigrants | Western Europe | 97.9 /100 | #100 | Exceptional 4.6% |
| Yugoslavians | 97.8 /100 | #101 | Exceptional 4.6% |
| Asians | 97.6 /100 | #102 | Exceptional 4.7% |
| Immigrants | Romania | 97.3 /100 | #103 | Exceptional 4.7% |
| Immigrants | Moldova | 97.1 /100 | #104 | Exceptional 4.7% |
| Aleuts | 97.0 /100 | #105 | Exceptional 4.7% |
| Immigrants | France | 96.9 /100 | #106 | Exceptional 4.7% |
| Immigrants | Germany | 96.8 /100 | #107 | Exceptional 4.7% |
| Laotians | 96.6 /100 | #108 | Exceptional 4.7% |
| Immigrants | Hong Kong | 96.4 /100 | #109 | Exceptional 4.7% |