Puerto Rican vs Apache Single Mother Poverty
COMPARE
Puerto Rican
Apache
Single Mother Poverty
Single Mother Poverty Comparison
Puerto Ricans
Apache
44.5%
SINGLE MOTHER POVERTY
0.0/ 100
METRIC RATING
347th/ 347
METRIC RANK
36.6%
SINGLE MOTHER POVERTY
0.0/ 100
METRIC RATING
329th/ 347
METRIC RANK
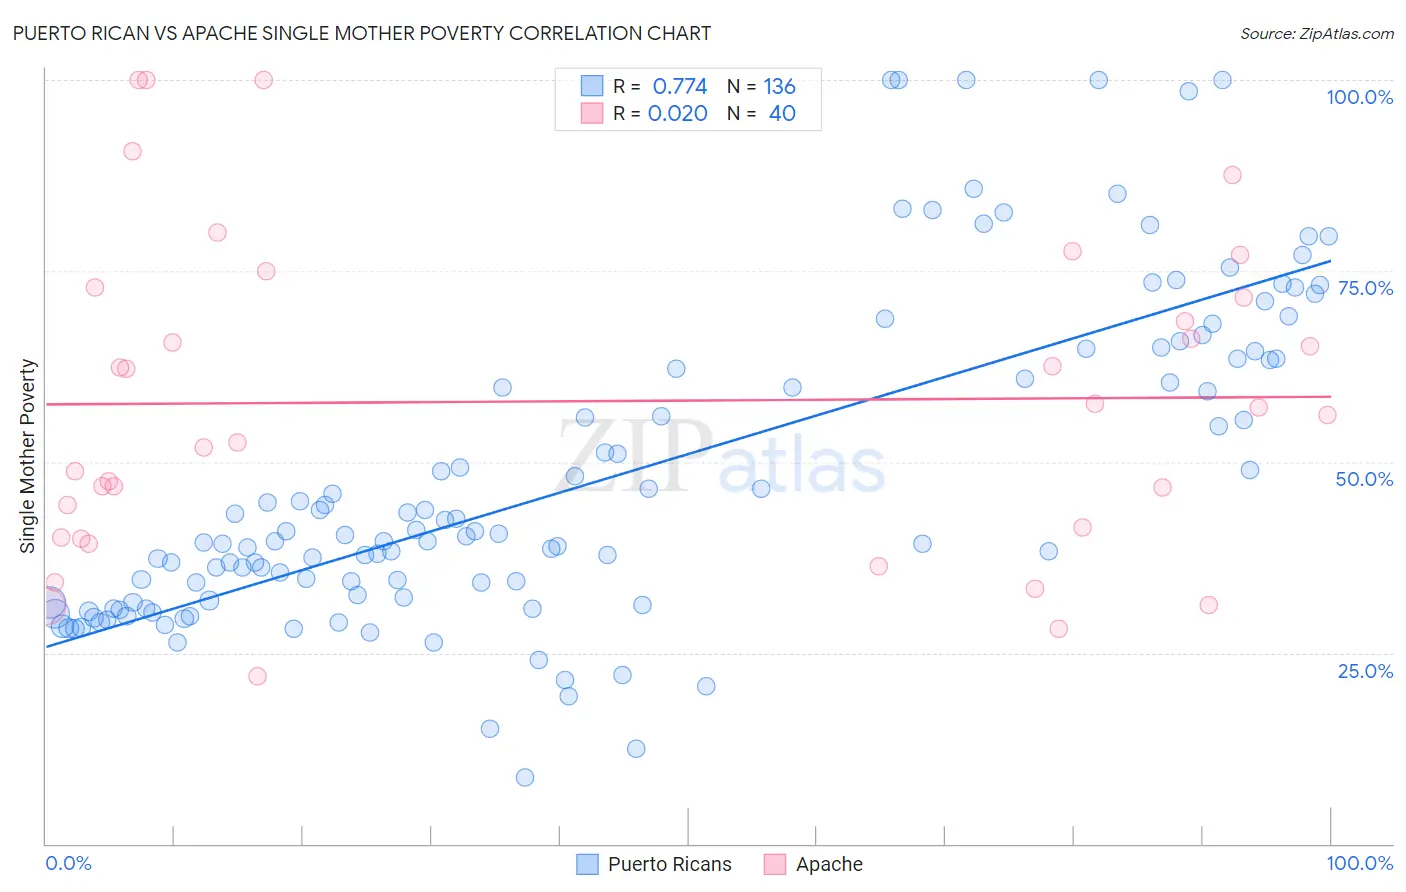
Puerto Rican vs Apache Single Mother Poverty Correlation Chart
The statistical analysis conducted on geographies consisting of 509,350,600 people shows a strong positive correlation between the proportion of Puerto Ricans and poverty level among single mothers in the United States with a correlation coefficient (R) of 0.774 and weighted average of 44.5%. Similarly, the statistical analysis conducted on geographies consisting of 229,112,849 people shows no correlation between the proportion of Apache and poverty level among single mothers in the United States with a correlation coefficient (R) of 0.020 and weighted average of 36.6%, a difference of 21.7%.
Single Mother Poverty Correlation Summary
| Measurement | Puerto Rican | Apache |
| Minimum | 8.7% | 21.9% |
| Maximum | 100.0% | 100.0% |
| Range | 91.3% | 78.1% |
| Mean | 47.8% | 57.9% |
| Median | 40.4% | 56.6% |
| Interquartile 25% (IQ1) | 31.7% | 40.8% |
| Interquartile 75% (IQ3) | 63.4% | 72.2% |
| Interquartile Range (IQR) | 31.7% | 31.4% |
| Standard Deviation (Sample) | 20.8% | 20.8% |
| Standard Deviation (Population) | 20.8% | 20.5% |
Demographics Similar to Puerto Ricans and Apache by Single Mother Poverty
In terms of single mother poverty, the demographic groups most similar to Puerto Ricans are Houma (43.5%, a difference of 2.4%), Lumbee (43.2%, a difference of 3.0%), Tohono O'odham (43.0%, a difference of 3.5%), Cajun (40.3%, a difference of 10.4%), and Navajo (40.2%, a difference of 10.8%). Similarly, the demographic groups most similar to Apache are Native/Alaskan (36.6%, a difference of 0.10%), Creek (36.7%, a difference of 0.26%), Choctaw (36.4%, a difference of 0.48%), Dutch West Indian (36.8%, a difference of 0.50%), and Menominee (37.1%, a difference of 1.3%).
| Demographics | Rating | Rank | Single Mother Poverty |
| Choctaw | 0.0 /100 | #328 | Tragic 36.4% |
| Apache | 0.0 /100 | #329 | Tragic 36.6% |
| Natives/Alaskans | 0.0 /100 | #330 | Tragic 36.6% |
| Creek | 0.0 /100 | #331 | Tragic 36.7% |
| Dutch West Indians | 0.0 /100 | #332 | Tragic 36.8% |
| Menominee | 0.0 /100 | #333 | Tragic 37.1% |
| Pueblo | 0.0 /100 | #334 | Tragic 37.2% |
| Yuman | 0.0 /100 | #335 | Tragic 37.8% |
| Cheyenne | 0.0 /100 | #336 | Tragic 38.5% |
| Immigrants | Yemen | 0.0 /100 | #337 | Tragic 38.5% |
| Pima | 0.0 /100 | #338 | Tragic 38.6% |
| Crow | 0.0 /100 | #339 | Tragic 38.6% |
| Sioux | 0.0 /100 | #340 | Tragic 38.8% |
| Colville | 0.0 /100 | #341 | Tragic 39.3% |
| Navajo | 0.0 /100 | #342 | Tragic 40.2% |
| Cajuns | 0.0 /100 | #343 | Tragic 40.3% |
| Tohono O'odham | 0.0 /100 | #344 | Tragic 43.0% |
| Lumbee | 0.0 /100 | #345 | Tragic 43.2% |
| Houma | 0.0 /100 | #346 | Tragic 43.5% |
| Puerto Ricans | 0.0 /100 | #347 | Tragic 44.5% |