Ukrainian vs Apache Single Mother Poverty
COMPARE
Ukrainian
Apache
Single Mother Poverty
Single Mother Poverty Comparison
Ukrainians
Apache
28.0%
SINGLE MOTHER POVERTY
96.4/ 100
METRIC RATING
106th/ 347
METRIC RANK
36.6%
SINGLE MOTHER POVERTY
0.0/ 100
METRIC RATING
329th/ 347
METRIC RANK
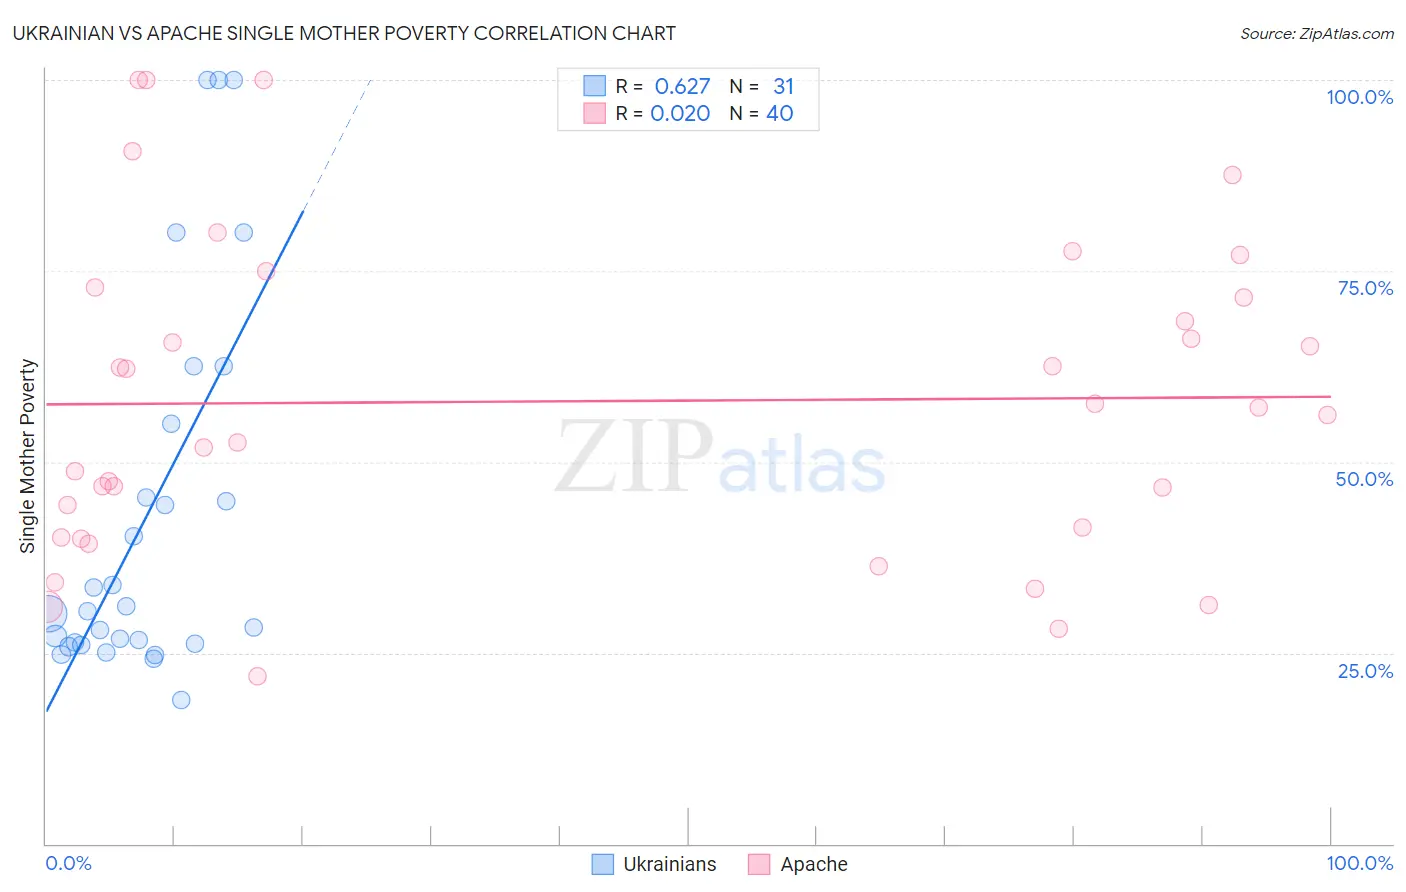
Ukrainian vs Apache Single Mother Poverty Correlation Chart
The statistical analysis conducted on geographies consisting of 432,495,804 people shows a significant positive correlation between the proportion of Ukrainians and poverty level among single mothers in the United States with a correlation coefficient (R) of 0.627 and weighted average of 28.0%. Similarly, the statistical analysis conducted on geographies consisting of 229,112,849 people shows no correlation between the proportion of Apache and poverty level among single mothers in the United States with a correlation coefficient (R) of 0.020 and weighted average of 36.6%, a difference of 30.6%.
Single Mother Poverty Correlation Summary
| Measurement | Ukrainian | Apache |
| Minimum | 18.8% | 21.9% |
| Maximum | 100.0% | 100.0% |
| Range | 81.2% | 78.1% |
| Mean | 43.0% | 57.9% |
| Median | 30.4% | 56.6% |
| Interquartile 25% (IQ1) | 26.3% | 40.8% |
| Interquartile 75% (IQ3) | 55.0% | 72.2% |
| Interquartile Range (IQR) | 28.7% | 31.4% |
| Standard Deviation (Sample) | 24.7% | 20.8% |
| Standard Deviation (Population) | 24.3% | 20.5% |
Similar Demographics by Single Mother Poverty
Demographics Similar to Ukrainians by Single Mother Poverty
In terms of single mother poverty, the demographic groups most similar to Ukrainians are Israeli (28.0%, a difference of 0.040%), Italian (28.0%, a difference of 0.070%), Immigrants from Northern Africa (28.0%, a difference of 0.090%), Immigrants from Croatia (28.0%, a difference of 0.10%), and Pakistani (28.0%, a difference of 0.20%).
| Demographics | Rating | Rank | Single Mother Poverty |
| Immigrants | Netherlands | 97.2 /100 | #99 | Exceptional 27.9% |
| Zimbabweans | 97.1 /100 | #100 | Exceptional 27.9% |
| Pakistanis | 96.9 /100 | #101 | Exceptional 28.0% |
| Immigrants | Croatia | 96.7 /100 | #102 | Exceptional 28.0% |
| Immigrants | Northern Africa | 96.6 /100 | #103 | Exceptional 28.0% |
| Italians | 96.6 /100 | #104 | Exceptional 28.0% |
| Israelis | 96.5 /100 | #105 | Exceptional 28.0% |
| Ukrainians | 96.4 /100 | #106 | Exceptional 28.0% |
| Immigrants | Venezuela | 95.8 /100 | #107 | Exceptional 28.1% |
| Immigrants | Zimbabwe | 95.5 /100 | #108 | Exceptional 28.1% |
| Immigrants | Armenia | 95.2 /100 | #109 | Exceptional 28.1% |
| Croatians | 94.8 /100 | #110 | Exceptional 28.2% |
| Venezuelans | 94.5 /100 | #111 | Exceptional 28.2% |
| Immigrants | Kazakhstan | 94.5 /100 | #112 | Exceptional 28.2% |
| Immigrants | South Africa | 93.2 /100 | #113 | Exceptional 28.3% |
Demographics Similar to Apache by Single Mother Poverty
In terms of single mother poverty, the demographic groups most similar to Apache are Native/Alaskan (36.6%, a difference of 0.10%), Creek (36.7%, a difference of 0.26%), Choctaw (36.4%, a difference of 0.48%), Dutch West Indian (36.8%, a difference of 0.50%), and Yakama (36.4%, a difference of 0.53%).
| Demographics | Rating | Rank | Single Mother Poverty |
| Blacks/African Americans | 0.0 /100 | #322 | Tragic 35.2% |
| Kiowa | 0.0 /100 | #323 | Tragic 35.5% |
| Ottawa | 0.0 /100 | #324 | Tragic 35.5% |
| Ute | 0.0 /100 | #325 | Tragic 35.7% |
| Seminole | 0.0 /100 | #326 | Tragic 35.8% |
| Yakama | 0.0 /100 | #327 | Tragic 36.4% |
| Choctaw | 0.0 /100 | #328 | Tragic 36.4% |
| Apache | 0.0 /100 | #329 | Tragic 36.6% |
| Natives/Alaskans | 0.0 /100 | #330 | Tragic 36.6% |
| Creek | 0.0 /100 | #331 | Tragic 36.7% |
| Dutch West Indians | 0.0 /100 | #332 | Tragic 36.8% |
| Menominee | 0.0 /100 | #333 | Tragic 37.1% |
| Pueblo | 0.0 /100 | #334 | Tragic 37.2% |
| Yuman | 0.0 /100 | #335 | Tragic 37.8% |
| Cheyenne | 0.0 /100 | #336 | Tragic 38.5% |