Scottish vs Apache Single Mother Poverty
COMPARE
Scottish
Apache
Single Mother Poverty
Single Mother Poverty Comparison
Scottish
Apache
30.1%
SINGLE MOTHER POVERTY
6.0/ 100
METRIC RATING
226th/ 347
METRIC RANK
36.6%
SINGLE MOTHER POVERTY
0.0/ 100
METRIC RATING
329th/ 347
METRIC RANK
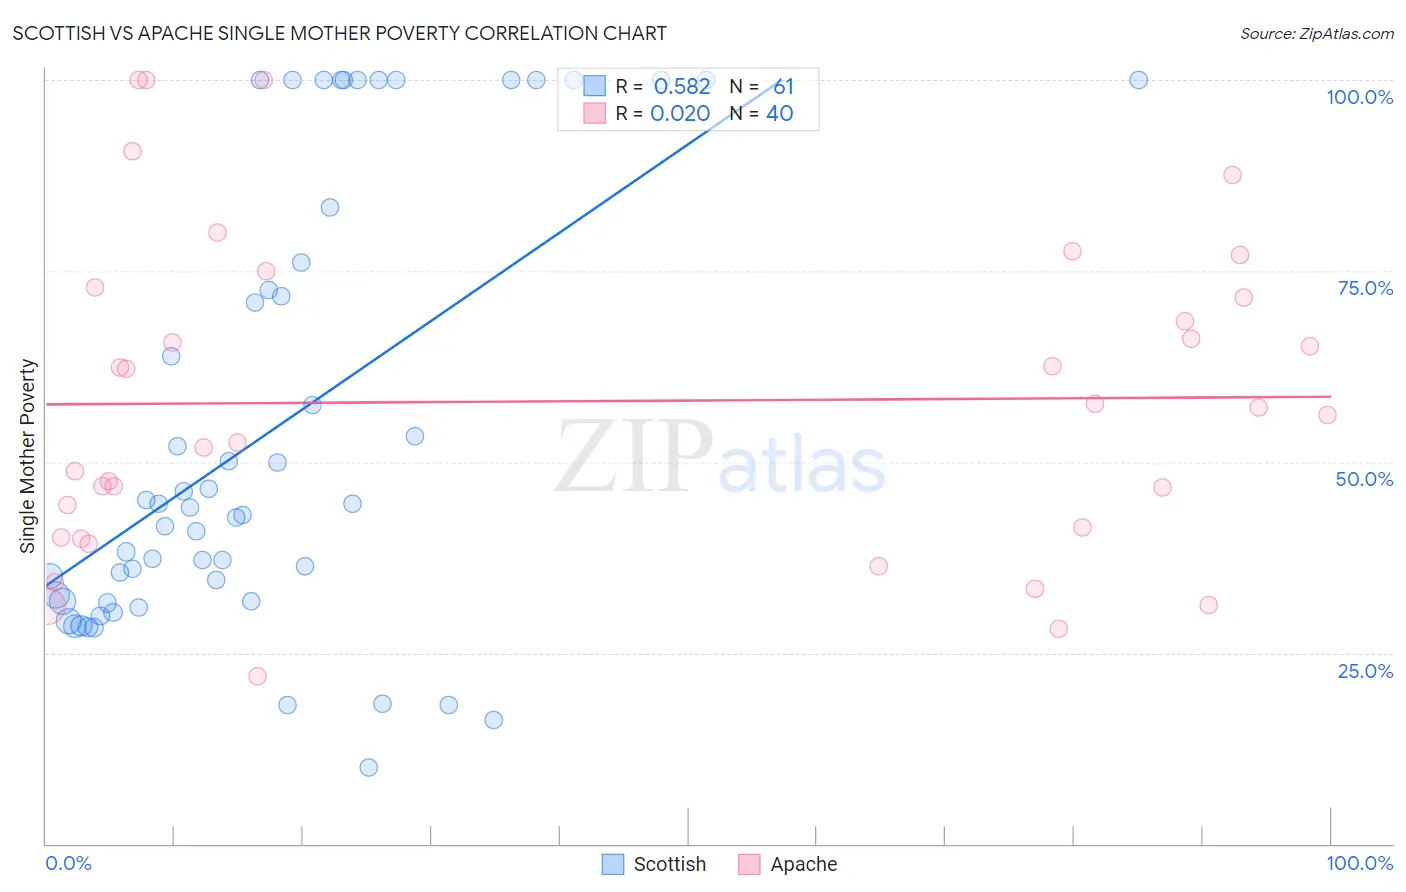
Scottish vs Apache Single Mother Poverty Correlation Chart
The statistical analysis conducted on geographies consisting of 539,065,597 people shows a substantial positive correlation between the proportion of Scottish and poverty level among single mothers in the United States with a correlation coefficient (R) of 0.582 and weighted average of 30.1%. Similarly, the statistical analysis conducted on geographies consisting of 229,112,849 people shows no correlation between the proportion of Apache and poverty level among single mothers in the United States with a correlation coefficient (R) of 0.020 and weighted average of 36.6%, a difference of 21.5%.
Single Mother Poverty Correlation Summary
| Measurement | Scottish | Apache |
| Minimum | 10.0% | 21.9% |
| Maximum | 100.0% | 100.0% |
| Range | 90.0% | 78.1% |
| Mean | 54.2% | 57.9% |
| Median | 44.1% | 56.6% |
| Interquartile 25% (IQ1) | 31.8% | 40.8% |
| Interquartile 75% (IQ3) | 79.8% | 72.2% |
| Interquartile Range (IQR) | 48.0% | 31.4% |
| Standard Deviation (Sample) | 28.9% | 20.8% |
| Standard Deviation (Population) | 28.6% | 20.5% |
Similar Demographics by Single Mother Poverty
Demographics Similar to Scottish by Single Mother Poverty
In terms of single mother poverty, the demographic groups most similar to Scottish are Immigrants from Liberia (30.1%, a difference of 0.030%), Spanish (30.1%, a difference of 0.060%), Immigrants from Sudan (30.1%, a difference of 0.090%), Spaniard (30.2%, a difference of 0.14%), and Immigrants from Cuba (30.1%, a difference of 0.16%).
| Demographics | Rating | Rank | Single Mother Poverty |
| Finns | 9.3 /100 | #219 | Tragic 30.0% |
| Germans | 8.8 /100 | #220 | Tragic 30.0% |
| Immigrants | Eritrea | 7.7 /100 | #221 | Tragic 30.0% |
| Sudanese | 7.6 /100 | #222 | Tragic 30.0% |
| Immigrants | Cuba | 6.9 /100 | #223 | Tragic 30.1% |
| Immigrants | Sudan | 6.5 /100 | #224 | Tragic 30.1% |
| Spanish | 6.3 /100 | #225 | Tragic 30.1% |
| Scottish | 6.0 /100 | #226 | Tragic 30.1% |
| Immigrants | Liberia | 5.9 /100 | #227 | Tragic 30.1% |
| Spaniards | 5.4 /100 | #228 | Tragic 30.2% |
| Immigrants | Barbados | 5.0 /100 | #229 | Tragic 30.2% |
| English | 4.8 /100 | #230 | Tragic 30.2% |
| Dutch | 4.3 /100 | #231 | Tragic 30.2% |
| Alaskan Athabascans | 4.1 /100 | #232 | Tragic 30.3% |
| Immigrants | Middle Africa | 3.5 /100 | #233 | Tragic 30.3% |
Demographics Similar to Apache by Single Mother Poverty
In terms of single mother poverty, the demographic groups most similar to Apache are Native/Alaskan (36.6%, a difference of 0.10%), Creek (36.7%, a difference of 0.26%), Choctaw (36.4%, a difference of 0.48%), Dutch West Indian (36.8%, a difference of 0.50%), and Yakama (36.4%, a difference of 0.53%).
| Demographics | Rating | Rank | Single Mother Poverty |
| Blacks/African Americans | 0.0 /100 | #322 | Tragic 35.2% |
| Kiowa | 0.0 /100 | #323 | Tragic 35.5% |
| Ottawa | 0.0 /100 | #324 | Tragic 35.5% |
| Ute | 0.0 /100 | #325 | Tragic 35.7% |
| Seminole | 0.0 /100 | #326 | Tragic 35.8% |
| Yakama | 0.0 /100 | #327 | Tragic 36.4% |
| Choctaw | 0.0 /100 | #328 | Tragic 36.4% |
| Apache | 0.0 /100 | #329 | Tragic 36.6% |
| Natives/Alaskans | 0.0 /100 | #330 | Tragic 36.6% |
| Creek | 0.0 /100 | #331 | Tragic 36.7% |
| Dutch West Indians | 0.0 /100 | #332 | Tragic 36.8% |
| Menominee | 0.0 /100 | #333 | Tragic 37.1% |
| Pueblo | 0.0 /100 | #334 | Tragic 37.2% |
| Yuman | 0.0 /100 | #335 | Tragic 37.8% |
| Cheyenne | 0.0 /100 | #336 | Tragic 38.5% |