Puerto Rican vs Apache Births to Unmarried Women
COMPARE
Puerto Rican
Apache
Births to Unmarried Women
Births to Unmarried Women Comparison
Puerto Ricans
Apache
45.7%
BIRTHS TO UNMARRIED WOMEN
0.0/ 100
METRIC RATING
336th/ 347
METRIC RANK
39.9%
BIRTHS TO UNMARRIED WOMEN
0.0/ 100
METRIC RATING
316th/ 347
METRIC RANK
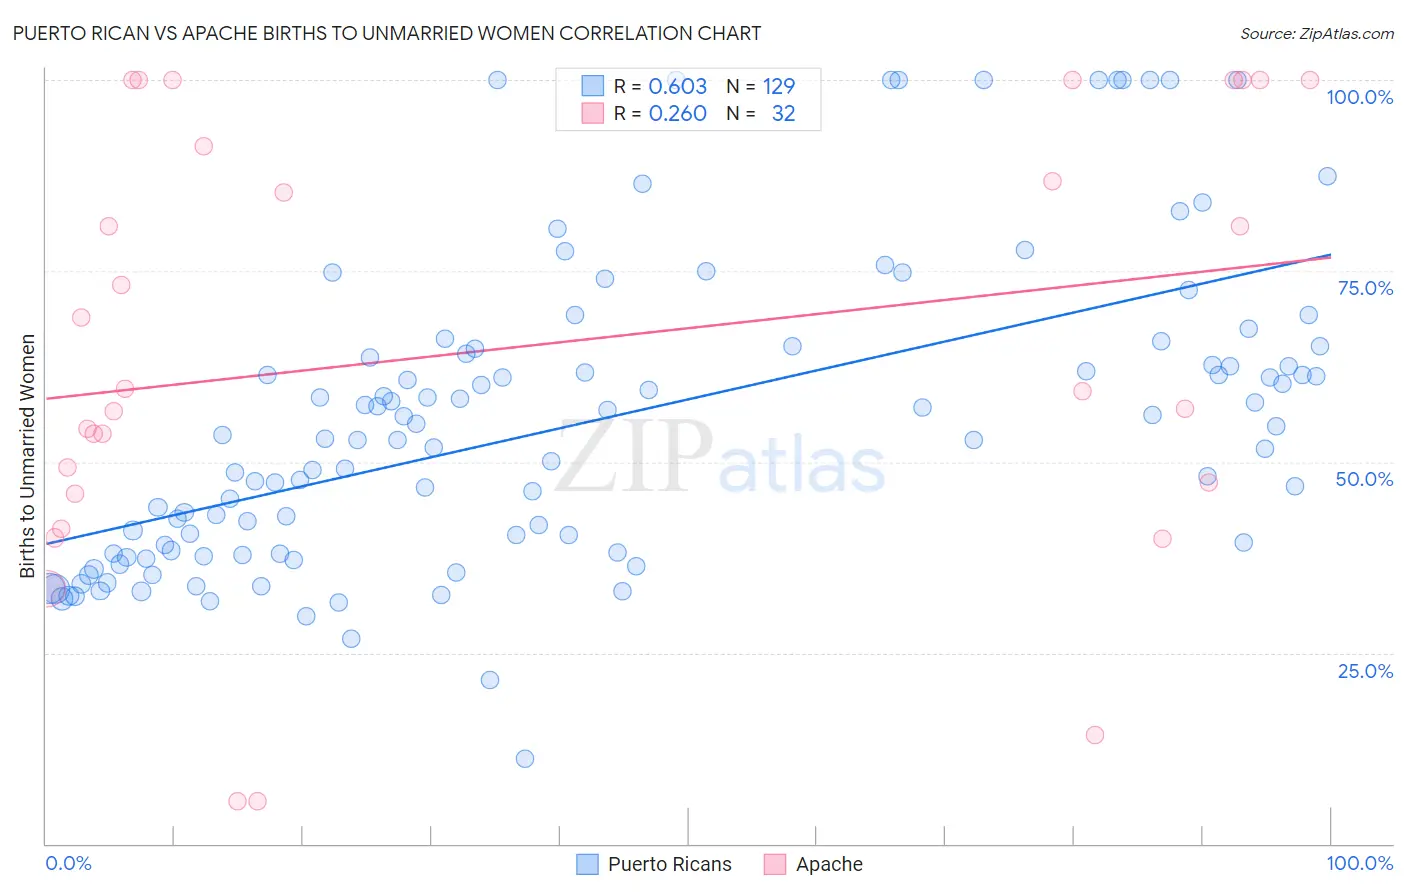
Puerto Rican vs Apache Births to Unmarried Women Correlation Chart
The statistical analysis conducted on geographies consisting of 481,236,419 people shows a significant positive correlation between the proportion of Puerto Ricans and percentage of births to unmarried women in the United States with a correlation coefficient (R) of 0.603 and weighted average of 45.7%. Similarly, the statistical analysis conducted on geographies consisting of 223,899,769 people shows a weak positive correlation between the proportion of Apache and percentage of births to unmarried women in the United States with a correlation coefficient (R) of 0.260 and weighted average of 39.9%, a difference of 14.6%.
Births to Unmarried Women Correlation Summary
| Measurement | Puerto Rican | Apache |
| Minimum | 11.1% | 5.6% |
| Maximum | 100.0% | 100.0% |
| Range | 88.9% | 94.4% |
| Mean | 55.2% | 65.1% |
| Median | 53.0% | 59.4% |
| Interquartile 25% (IQ1) | 38.0% | 46.6% |
| Interquartile 75% (IQ3) | 64.5% | 95.7% |
| Interquartile Range (IQR) | 26.5% | 49.1% |
| Standard Deviation (Sample) | 20.1% | 28.9% |
| Standard Deviation (Population) | 20.0% | 28.4% |
Demographics Similar to Puerto Ricans and Apache by Births to Unmarried Women
In terms of births to unmarried women, the demographic groups most similar to Puerto Ricans are Colville (45.3%, a difference of 0.78%), Yuman (44.4%, a difference of 2.9%), Black/African American (44.3%, a difference of 3.1%), Kiowa (43.1%, a difference of 5.9%), and Native/Alaskan (43.0%, a difference of 6.2%). Similarly, the demographic groups most similar to Apache are Immigrants from Dominican Republic (40.1%, a difference of 0.55%), Immigrants from Bahamas (40.1%, a difference of 0.62%), Yakama (40.3%, a difference of 1.2%), Crow (40.4%, a difference of 1.2%), and Bahamian (40.8%, a difference of 2.3%).
| Demographics | Rating | Rank | Births to Unmarried Women |
| Apache | 0.0 /100 | #316 | Tragic 39.9% |
| Immigrants | Dominican Republic | 0.0 /100 | #317 | Tragic 40.1% |
| Immigrants | Bahamas | 0.0 /100 | #318 | Tragic 40.1% |
| Yakama | 0.0 /100 | #319 | Tragic 40.3% |
| Crow | 0.0 /100 | #320 | Tragic 40.4% |
| Bahamians | 0.0 /100 | #321 | Tragic 40.8% |
| Cajuns | 0.0 /100 | #322 | Tragic 41.0% |
| Sioux | 0.0 /100 | #323 | Tragic 41.0% |
| Cape Verdeans | 0.0 /100 | #324 | Tragic 41.3% |
| Cheyenne | 0.0 /100 | #325 | Tragic 41.3% |
| Immigrants | Cuba | 0.0 /100 | #326 | Tragic 41.5% |
| Tsimshian | 0.0 /100 | #327 | Tragic 42.2% |
| Immigrants | Cabo Verde | 0.0 /100 | #328 | Tragic 42.2% |
| Paiute | 0.0 /100 | #329 | Tragic 42.5% |
| Chippewa | 0.0 /100 | #330 | Tragic 42.6% |
| Natives/Alaskans | 0.0 /100 | #331 | Tragic 43.0% |
| Kiowa | 0.0 /100 | #332 | Tragic 43.1% |
| Blacks/African Americans | 0.0 /100 | #333 | Tragic 44.3% |
| Yuman | 0.0 /100 | #334 | Tragic 44.4% |
| Colville | 0.0 /100 | #335 | Tragic 45.3% |
| Puerto Ricans | 0.0 /100 | #336 | Tragic 45.7% |