Puerto Rican vs Apache In Labor Force | Age 30-34
COMPARE
Puerto Rican
Apache
In Labor Force | Age 30-34
In Labor Force | Age 30-34 Comparison
Puerto Ricans
Apache
81.2%
IN LABOR FORCE | AGE 30-34
0.0/ 100
METRIC RATING
322nd/ 347
METRIC RANK
79.0%
IN LABOR FORCE | AGE 30-34
0.0/ 100
METRIC RATING
339th/ 347
METRIC RANK
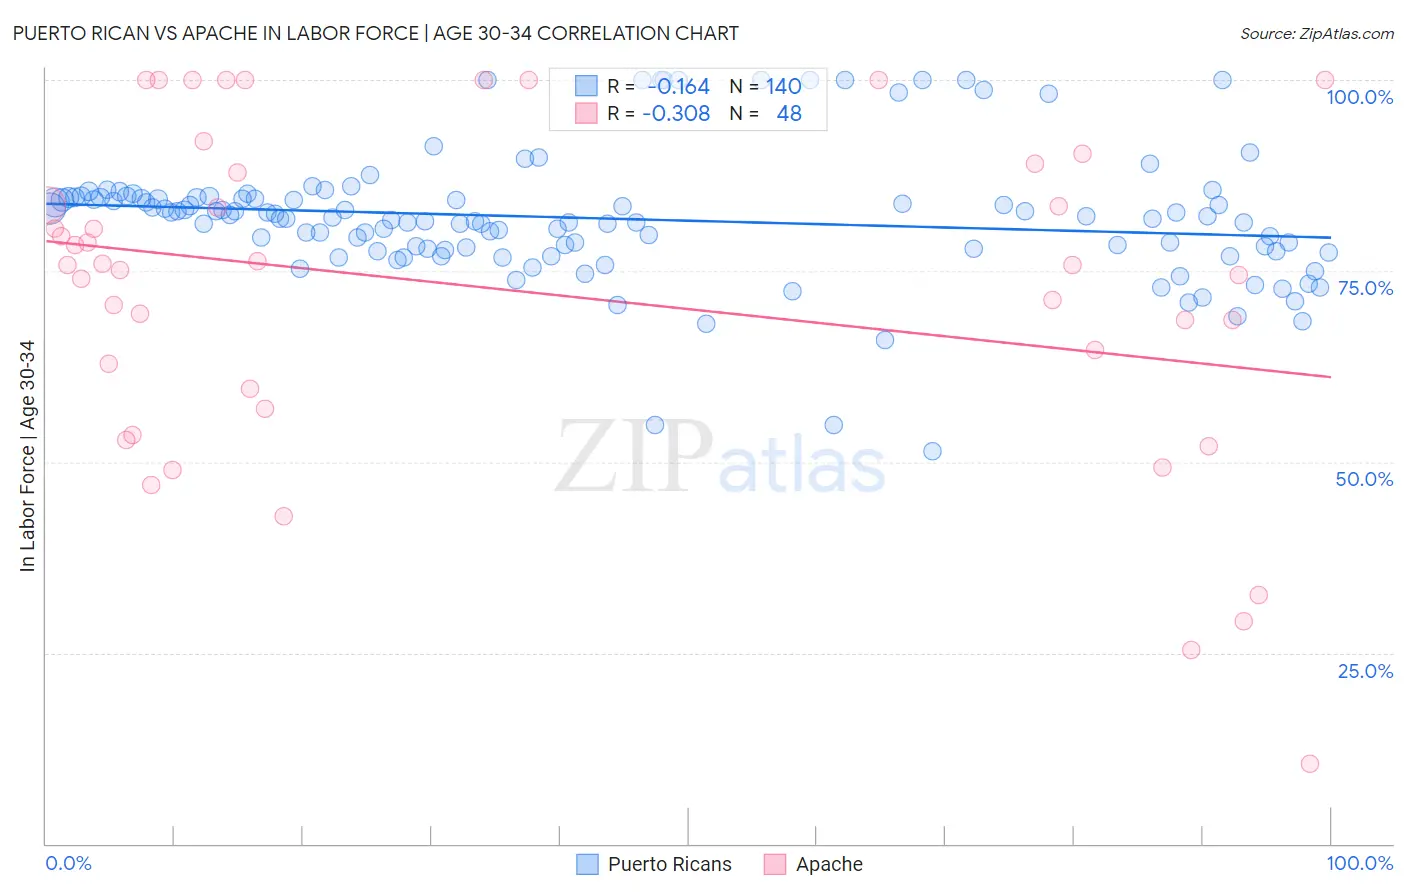
Puerto Rican vs Apache In Labor Force | Age 30-34 Correlation Chart
The statistical analysis conducted on geographies consisting of 527,590,157 people shows a poor negative correlation between the proportion of Puerto Ricans and labor force participation rate among population between the ages 30 and 34 in the United States with a correlation coefficient (R) of -0.164 and weighted average of 81.2%. Similarly, the statistical analysis conducted on geographies consisting of 231,033,691 people shows a mild negative correlation between the proportion of Apache and labor force participation rate among population between the ages 30 and 34 in the United States with a correlation coefficient (R) of -0.308 and weighted average of 79.0%, a difference of 2.8%.
In Labor Force | Age 30-34 Correlation Summary
| Measurement | Puerto Rican | Apache |
| Minimum | 51.4% | 10.5% |
| Maximum | 100.0% | 100.0% |
| Range | 48.6% | 89.5% |
| Mean | 81.9% | 72.3% |
| Median | 82.0% | 75.7% |
| Interquartile 25% (IQ1) | 77.8% | 58.3% |
| Interquartile 75% (IQ3) | 84.6% | 88.5% |
| Interquartile Range (IQR) | 6.8% | 30.2% |
| Standard Deviation (Sample) | 8.5% | 21.9% |
| Standard Deviation (Population) | 8.4% | 21.7% |
Demographics Similar to Puerto Ricans and Apache by In Labor Force | Age 30-34
In terms of in labor force | age 30-34, the demographic groups most similar to Puerto Ricans are Paiute (81.2%, a difference of 0.050%), Cheyenne (81.1%, a difference of 0.080%), Alaska Native (81.3%, a difference of 0.16%), Dutch West Indian (81.0%, a difference of 0.23%), and Yaqui (81.4%, a difference of 0.24%). Similarly, the demographic groups most similar to Apache are Pima (79.0%, a difference of 0.030%), Ute (78.9%, a difference of 0.10%), Yakama (79.1%, a difference of 0.15%), Native/Alaskan (79.2%, a difference of 0.19%), and Marshallese (79.2%, a difference of 0.27%).
| Demographics | Rating | Rank | In Labor Force | Age 30-34 |
| Yaqui | 0.0 /100 | #320 | Tragic 81.4% |
| Alaska Natives | 0.0 /100 | #321 | Tragic 81.3% |
| Puerto Ricans | 0.0 /100 | #322 | Tragic 81.2% |
| Paiute | 0.0 /100 | #323 | Tragic 81.2% |
| Cheyenne | 0.0 /100 | #324 | Tragic 81.1% |
| Dutch West Indians | 0.0 /100 | #325 | Tragic 81.0% |
| Seminole | 0.0 /100 | #326 | Tragic 80.8% |
| Colville | 0.0 /100 | #327 | Tragic 80.7% |
| Sioux | 0.0 /100 | #328 | Tragic 80.4% |
| Creek | 0.0 /100 | #329 | Tragic 80.4% |
| Pueblo | 0.0 /100 | #330 | Tragic 80.0% |
| Houma | 0.0 /100 | #331 | Tragic 79.9% |
| Kiowa | 0.0 /100 | #332 | Tragic 79.8% |
| Inupiat | 0.0 /100 | #333 | Tragic 79.7% |
| Hopi | 0.0 /100 | #334 | Tragic 79.3% |
| Marshallese | 0.0 /100 | #335 | Tragic 79.2% |
| Natives/Alaskans | 0.0 /100 | #336 | Tragic 79.2% |
| Yakama | 0.0 /100 | #337 | Tragic 79.1% |
| Pima | 0.0 /100 | #338 | Tragic 79.0% |
| Apache | 0.0 /100 | #339 | Tragic 79.0% |
| Ute | 0.0 /100 | #340 | Tragic 78.9% |