Japanese vs Apache Single Mother Poverty
COMPARE
Japanese
Apache
Single Mother Poverty
Single Mother Poverty Comparison
Japanese
Apache
28.9%
SINGLE MOTHER POVERTY
68.0/ 100
METRIC RATING
160th/ 347
METRIC RANK
36.6%
SINGLE MOTHER POVERTY
0.0/ 100
METRIC RATING
329th/ 347
METRIC RANK
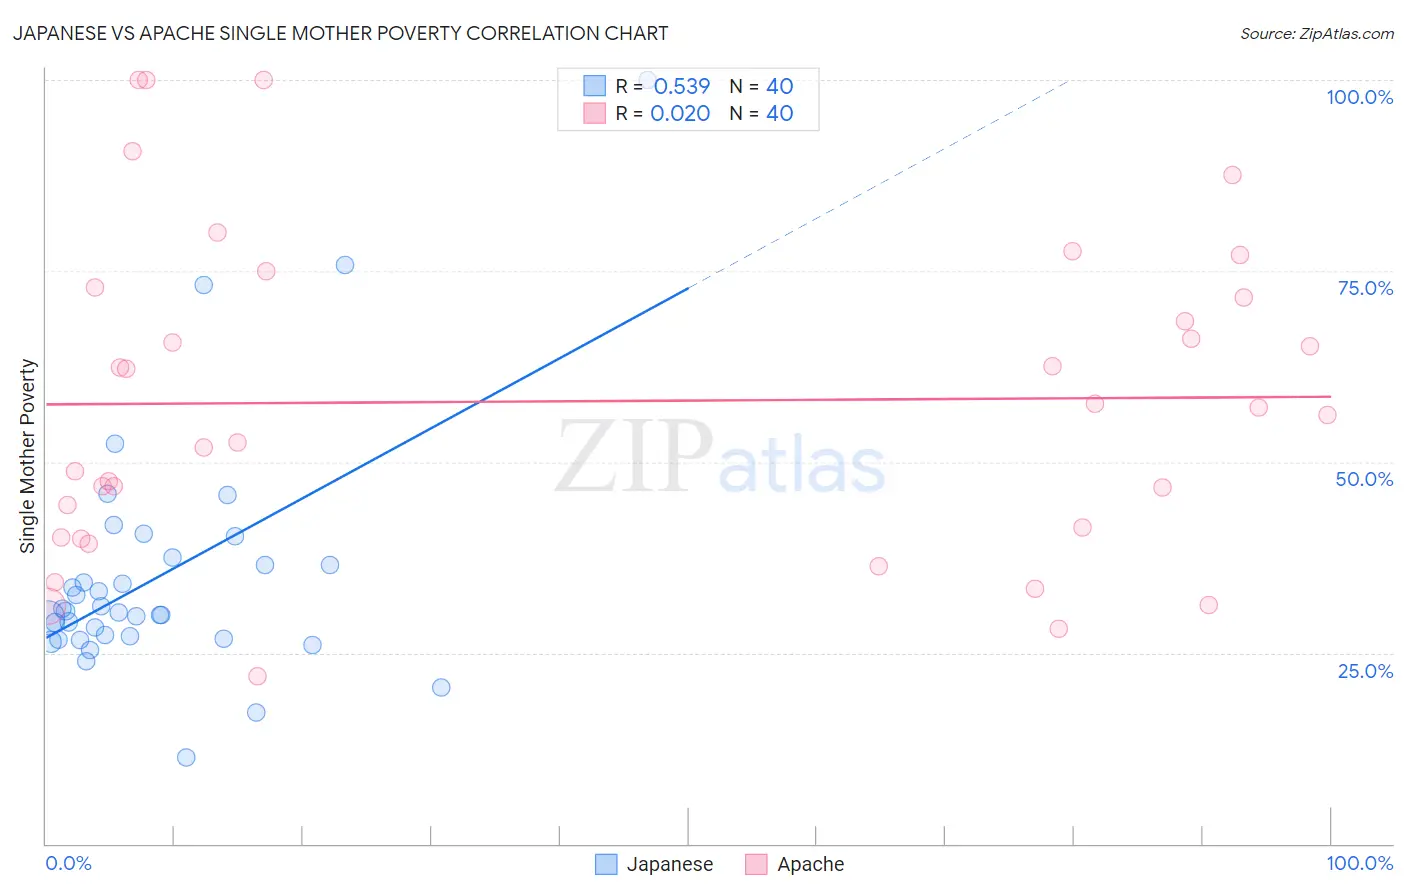
Japanese vs Apache Single Mother Poverty Correlation Chart
The statistical analysis conducted on geographies consisting of 246,409,359 people shows a substantial positive correlation between the proportion of Japanese and poverty level among single mothers in the United States with a correlation coefficient (R) of 0.539 and weighted average of 28.9%. Similarly, the statistical analysis conducted on geographies consisting of 229,112,849 people shows no correlation between the proportion of Apache and poverty level among single mothers in the United States with a correlation coefficient (R) of 0.020 and weighted average of 36.6%, a difference of 26.6%.
Single Mother Poverty Correlation Summary
| Measurement | Japanese | Apache |
| Minimum | 11.3% | 21.9% |
| Maximum | 100.0% | 100.0% |
| Range | 88.7% | 78.1% |
| Mean | 35.2% | 57.9% |
| Median | 30.4% | 56.6% |
| Interquartile 25% (IQ1) | 27.0% | 40.8% |
| Interquartile 75% (IQ3) | 37.0% | 72.2% |
| Interquartile Range (IQR) | 10.0% | 31.4% |
| Standard Deviation (Sample) | 16.1% | 20.8% |
| Standard Deviation (Population) | 15.9% | 20.5% |
Similar Demographics by Single Mother Poverty
Demographics Similar to Japanese by Single Mother Poverty
In terms of single mother poverty, the demographic groups most similar to Japanese are Czech (28.9%, a difference of 0.020%), Immigrants from Cambodia (28.9%, a difference of 0.080%), Scandinavian (28.9%, a difference of 0.10%), Immigrants from Nigeria (28.9%, a difference of 0.11%), and Immigrants from Kenya (28.9%, a difference of 0.11%).
| Demographics | Rating | Rank | Single Mother Poverty |
| Slovenes | 76.4 /100 | #153 | Good 28.8% |
| Portuguese | 73.2 /100 | #154 | Good 28.8% |
| Ugandans | 71.7 /100 | #155 | Good 28.8% |
| Iraqis | 71.5 /100 | #156 | Good 28.8% |
| Immigrants | Western Europe | 71.1 /100 | #157 | Good 28.9% |
| Immigrants | Hungary | 70.6 /100 | #158 | Good 28.9% |
| Czechs | 68.4 /100 | #159 | Good 28.9% |
| Japanese | 68.0 /100 | #160 | Good 28.9% |
| Immigrants | Cambodia | 66.6 /100 | #161 | Good 28.9% |
| Scandinavians | 66.2 /100 | #162 | Good 28.9% |
| Immigrants | Nigeria | 65.9 /100 | #163 | Good 28.9% |
| Immigrants | Kenya | 65.9 /100 | #164 | Good 28.9% |
| Arabs | 60.7 /100 | #165 | Good 29.0% |
| Inupiat | 60.4 /100 | #166 | Good 29.0% |
| Costa Ricans | 58.4 /100 | #167 | Average 29.0% |
Demographics Similar to Apache by Single Mother Poverty
In terms of single mother poverty, the demographic groups most similar to Apache are Native/Alaskan (36.6%, a difference of 0.10%), Creek (36.7%, a difference of 0.26%), Choctaw (36.4%, a difference of 0.48%), Dutch West Indian (36.8%, a difference of 0.50%), and Yakama (36.4%, a difference of 0.53%).
| Demographics | Rating | Rank | Single Mother Poverty |
| Blacks/African Americans | 0.0 /100 | #322 | Tragic 35.2% |
| Kiowa | 0.0 /100 | #323 | Tragic 35.5% |
| Ottawa | 0.0 /100 | #324 | Tragic 35.5% |
| Ute | 0.0 /100 | #325 | Tragic 35.7% |
| Seminole | 0.0 /100 | #326 | Tragic 35.8% |
| Yakama | 0.0 /100 | #327 | Tragic 36.4% |
| Choctaw | 0.0 /100 | #328 | Tragic 36.4% |
| Apache | 0.0 /100 | #329 | Tragic 36.6% |
| Natives/Alaskans | 0.0 /100 | #330 | Tragic 36.6% |
| Creek | 0.0 /100 | #331 | Tragic 36.7% |
| Dutch West Indians | 0.0 /100 | #332 | Tragic 36.8% |
| Menominee | 0.0 /100 | #333 | Tragic 37.1% |
| Pueblo | 0.0 /100 | #334 | Tragic 37.2% |
| Yuman | 0.0 /100 | #335 | Tragic 37.8% |
| Cheyenne | 0.0 /100 | #336 | Tragic 38.5% |