Puerto Rican vs Tsimshian Single Mother Poverty
COMPARE
Puerto Rican
Tsimshian
Single Mother Poverty
Single Mother Poverty Comparison
Puerto Ricans
Tsimshian
44.5%
SINGLE MOTHER POVERTY
0.0/ 100
METRIC RATING
347th/ 347
METRIC RANK
26.8%
SINGLE MOTHER POVERTY
99.9/ 100
METRIC RATING
43rd/ 347
METRIC RANK
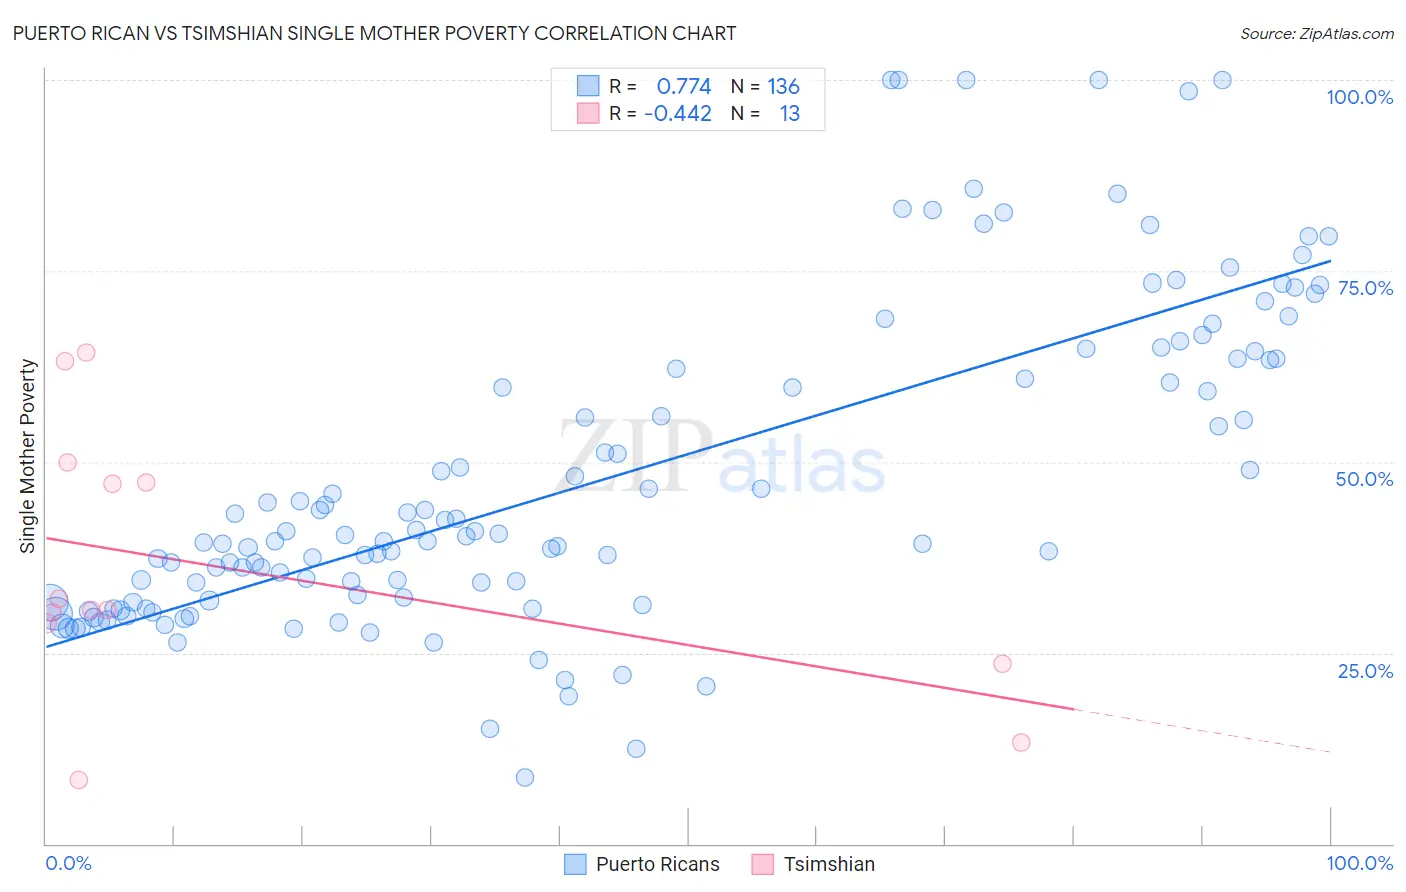
Puerto Rican vs Tsimshian Single Mother Poverty Correlation Chart
The statistical analysis conducted on geographies consisting of 509,350,600 people shows a strong positive correlation between the proportion of Puerto Ricans and poverty level among single mothers in the United States with a correlation coefficient (R) of 0.774 and weighted average of 44.5%. Similarly, the statistical analysis conducted on geographies consisting of 15,606,004 people shows a moderate negative correlation between the proportion of Tsimshian and poverty level among single mothers in the United States with a correlation coefficient (R) of -0.442 and weighted average of 26.8%, a difference of 66.0%.
Single Mother Poverty Correlation Summary
| Measurement | Puerto Rican | Tsimshian |
| Minimum | 8.7% | 8.3% |
| Maximum | 100.0% | 64.3% |
| Range | 91.3% | 56.0% |
| Mean | 47.8% | 36.1% |
| Median | 40.4% | 30.6% |
| Interquartile 25% (IQ1) | 31.7% | 26.2% |
| Interquartile 75% (IQ3) | 63.4% | 48.7% |
| Interquartile Range (IQR) | 31.7% | 22.5% |
| Standard Deviation (Sample) | 20.8% | 17.3% |
| Standard Deviation (Population) | 20.8% | 16.6% |
Similar Demographics by Single Mother Poverty
Demographics Similar to Puerto Ricans by Single Mother Poverty
In terms of single mother poverty, the demographic groups most similar to Puerto Ricans are Houma (43.5%, a difference of 2.4%), Lumbee (43.2%, a difference of 3.0%), Tohono O'odham (43.0%, a difference of 3.5%), Cajun (40.3%, a difference of 10.4%), and Navajo (40.2%, a difference of 10.8%).
| Demographics | Rating | Rank | Single Mother Poverty |
| Menominee | 0.0 /100 | #333 | Tragic 37.1% |
| Pueblo | 0.0 /100 | #334 | Tragic 37.2% |
| Yuman | 0.0 /100 | #335 | Tragic 37.8% |
| Cheyenne | 0.0 /100 | #336 | Tragic 38.5% |
| Immigrants | Yemen | 0.0 /100 | #337 | Tragic 38.5% |
| Pima | 0.0 /100 | #338 | Tragic 38.6% |
| Crow | 0.0 /100 | #339 | Tragic 38.6% |
| Sioux | 0.0 /100 | #340 | Tragic 38.8% |
| Colville | 0.0 /100 | #341 | Tragic 39.3% |
| Navajo | 0.0 /100 | #342 | Tragic 40.2% |
| Cajuns | 0.0 /100 | #343 | Tragic 40.3% |
| Tohono O'odham | 0.0 /100 | #344 | Tragic 43.0% |
| Lumbee | 0.0 /100 | #345 | Tragic 43.2% |
| Houma | 0.0 /100 | #346 | Tragic 43.5% |
| Puerto Ricans | 0.0 /100 | #347 | Tragic 44.5% |
Demographics Similar to Tsimshian by Single Mother Poverty
In terms of single mother poverty, the demographic groups most similar to Tsimshian are Armenian (26.8%, a difference of 0.080%), Immigrants from Sierra Leone (26.9%, a difference of 0.14%), Latvian (26.9%, a difference of 0.21%), Immigrants from Serbia (26.9%, a difference of 0.26%), and Immigrants from Greece (26.7%, a difference of 0.31%).
| Demographics | Rating | Rank | Single Mother Poverty |
| Okinawans | 99.9 /100 | #36 | Exceptional 26.6% |
| Immigrants | Israel | 99.9 /100 | #37 | Exceptional 26.6% |
| Immigrants | Fiji | 99.9 /100 | #38 | Exceptional 26.6% |
| Sri Lankans | 99.9 /100 | #39 | Exceptional 26.7% |
| Immigrants | Vietnam | 99.9 /100 | #40 | Exceptional 26.7% |
| Immigrants | Greece | 99.9 /100 | #41 | Exceptional 26.7% |
| Armenians | 99.9 /100 | #42 | Exceptional 26.8% |
| Tsimshian | 99.9 /100 | #43 | Exceptional 26.8% |
| Immigrants | Sierra Leone | 99.9 /100 | #44 | Exceptional 26.9% |
| Latvians | 99.9 /100 | #45 | Exceptional 26.9% |
| Immigrants | Serbia | 99.9 /100 | #46 | Exceptional 26.9% |
| Egyptians | 99.8 /100 | #47 | Exceptional 26.9% |
| Immigrants | Poland | 99.8 /100 | #48 | Exceptional 26.9% |
| Cambodians | 99.8 /100 | #49 | Exceptional 27.0% |
| Laotians | 99.8 /100 | #50 | Exceptional 27.0% |