Puerto Rican vs Honduran Single Mother Poverty
COMPARE
Puerto Rican
Honduran
Single Mother Poverty
Single Mother Poverty Comparison
Puerto Ricans
Hondurans
44.5%
SINGLE MOTHER POVERTY
0.0/ 100
METRIC RATING
347th/ 347
METRIC RANK
34.2%
SINGLE MOTHER POVERTY
0.0/ 100
METRIC RATING
310th/ 347
METRIC RANK
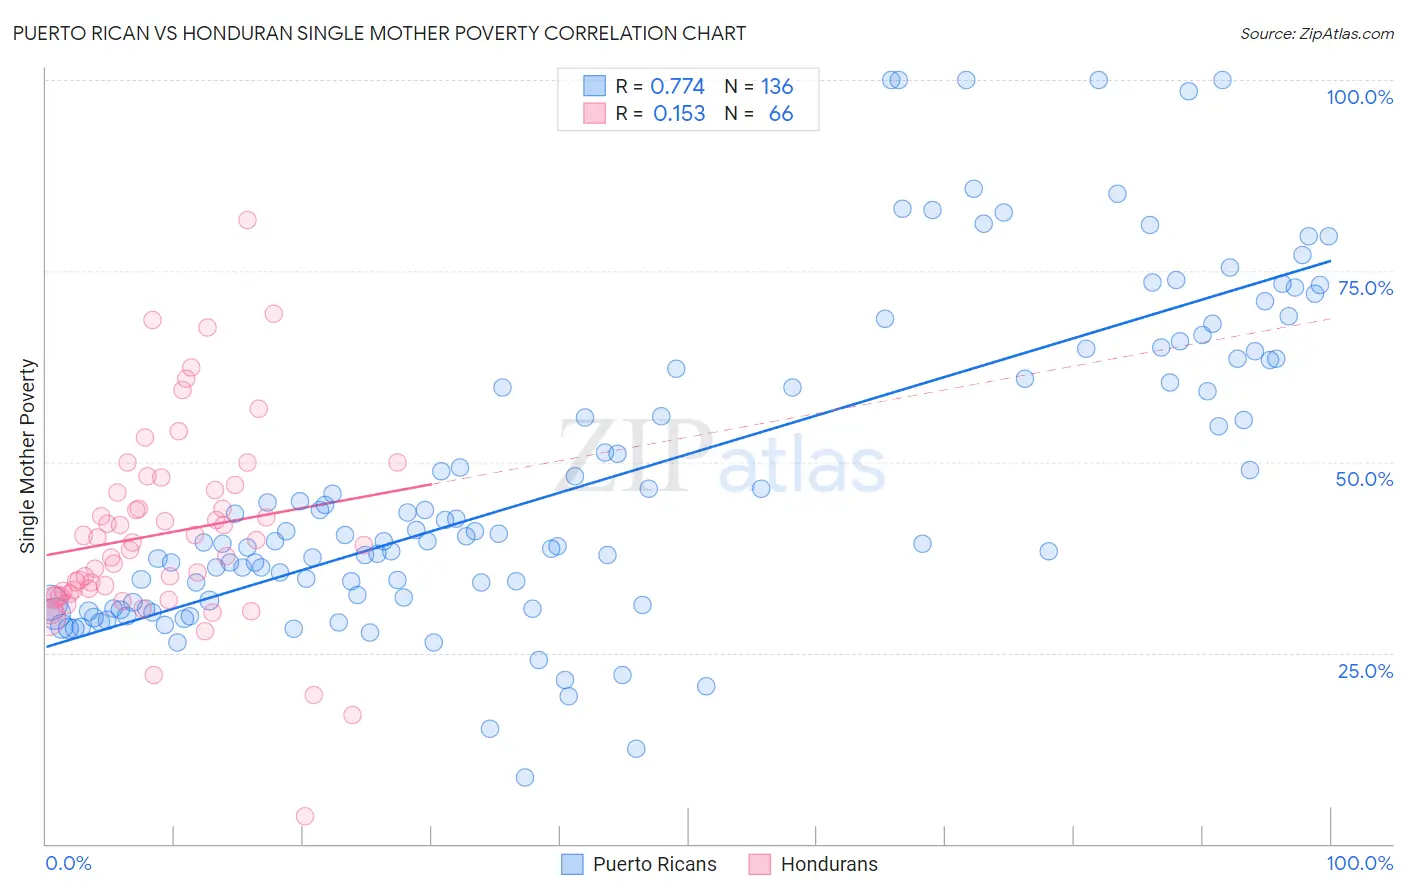
Puerto Rican vs Honduran Single Mother Poverty Correlation Chart
The statistical analysis conducted on geographies consisting of 509,350,600 people shows a strong positive correlation between the proportion of Puerto Ricans and poverty level among single mothers in the United States with a correlation coefficient (R) of 0.774 and weighted average of 44.5%. Similarly, the statistical analysis conducted on geographies consisting of 352,983,929 people shows a poor positive correlation between the proportion of Hondurans and poverty level among single mothers in the United States with a correlation coefficient (R) of 0.153 and weighted average of 34.2%, a difference of 30.2%.
Single Mother Poverty Correlation Summary
| Measurement | Puerto Rican | Honduran |
| Minimum | 8.7% | 3.6% |
| Maximum | 100.0% | 81.7% |
| Range | 91.3% | 78.2% |
| Mean | 47.8% | 40.6% |
| Median | 40.4% | 39.2% |
| Interquartile 25% (IQ1) | 31.7% | 32.8% |
| Interquartile 75% (IQ3) | 63.4% | 46.3% |
| Interquartile Range (IQR) | 31.7% | 13.5% |
| Standard Deviation (Sample) | 20.8% | 12.9% |
| Standard Deviation (Population) | 20.8% | 12.8% |
Similar Demographics by Single Mother Poverty
Demographics Similar to Puerto Ricans by Single Mother Poverty
In terms of single mother poverty, the demographic groups most similar to Puerto Ricans are Houma (43.5%, a difference of 2.4%), Lumbee (43.2%, a difference of 3.0%), Tohono O'odham (43.0%, a difference of 3.5%), Cajun (40.3%, a difference of 10.4%), and Navajo (40.2%, a difference of 10.8%).
| Demographics | Rating | Rank | Single Mother Poverty |
| Menominee | 0.0 /100 | #333 | Tragic 37.1% |
| Pueblo | 0.0 /100 | #334 | Tragic 37.2% |
| Yuman | 0.0 /100 | #335 | Tragic 37.8% |
| Cheyenne | 0.0 /100 | #336 | Tragic 38.5% |
| Immigrants | Yemen | 0.0 /100 | #337 | Tragic 38.5% |
| Pima | 0.0 /100 | #338 | Tragic 38.6% |
| Crow | 0.0 /100 | #339 | Tragic 38.6% |
| Sioux | 0.0 /100 | #340 | Tragic 38.8% |
| Colville | 0.0 /100 | #341 | Tragic 39.3% |
| Navajo | 0.0 /100 | #342 | Tragic 40.2% |
| Cajuns | 0.0 /100 | #343 | Tragic 40.3% |
| Tohono O'odham | 0.0 /100 | #344 | Tragic 43.0% |
| Lumbee | 0.0 /100 | #345 | Tragic 43.2% |
| Houma | 0.0 /100 | #346 | Tragic 43.5% |
| Puerto Ricans | 0.0 /100 | #347 | Tragic 44.5% |
Demographics Similar to Hondurans by Single Mother Poverty
In terms of single mother poverty, the demographic groups most similar to Hondurans are Potawatomi (34.1%, a difference of 0.22%), Alsatian (34.3%, a difference of 0.31%), Central American Indian (34.3%, a difference of 0.39%), Immigrants from Dominican Republic (34.4%, a difference of 0.47%), and Immigrants from Mexico (34.0%, a difference of 0.64%).
| Demographics | Rating | Rank | Single Mother Poverty |
| Americans | 0.0 /100 | #303 | Tragic 33.5% |
| Mexicans | 0.0 /100 | #304 | Tragic 33.6% |
| Immigrants | Central America | 0.0 /100 | #305 | Tragic 33.6% |
| Immigrants | Congo | 0.0 /100 | #306 | Tragic 33.8% |
| Comanche | 0.0 /100 | #307 | Tragic 33.9% |
| Immigrants | Mexico | 0.0 /100 | #308 | Tragic 34.0% |
| Potawatomi | 0.0 /100 | #309 | Tragic 34.1% |
| Hondurans | 0.0 /100 | #310 | Tragic 34.2% |
| Alsatians | 0.0 /100 | #311 | Tragic 34.3% |
| Central American Indians | 0.0 /100 | #312 | Tragic 34.3% |
| Immigrants | Dominican Republic | 0.0 /100 | #313 | Tragic 34.4% |
| Chickasaw | 0.0 /100 | #314 | Tragic 34.4% |
| Hopi | 0.0 /100 | #315 | Tragic 34.5% |
| Dominicans | 0.0 /100 | #316 | Tragic 34.5% |
| Cherokee | 0.0 /100 | #317 | Tragic 34.5% |