Puerto Rican vs Pakistani Single Mother Poverty
COMPARE
Puerto Rican
Pakistani
Single Mother Poverty
Single Mother Poverty Comparison
Puerto Ricans
Pakistanis
44.5%
SINGLE MOTHER POVERTY
0.0/ 100
METRIC RATING
347th/ 347
METRIC RANK
28.0%
SINGLE MOTHER POVERTY
96.9/ 100
METRIC RATING
101st/ 347
METRIC RANK
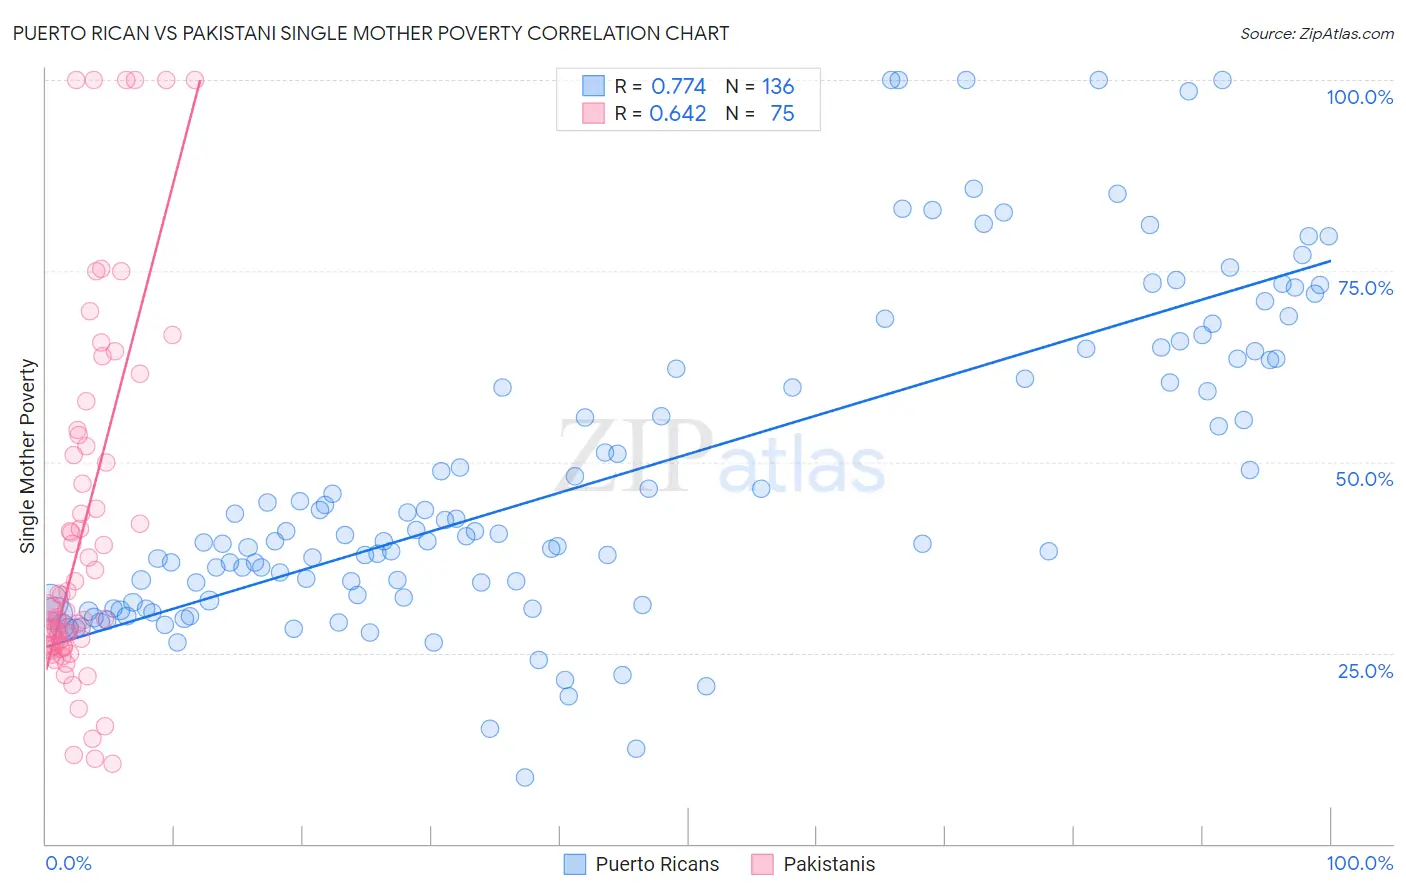
Puerto Rican vs Pakistani Single Mother Poverty Correlation Chart
The statistical analysis conducted on geographies consisting of 509,350,600 people shows a strong positive correlation between the proportion of Puerto Ricans and poverty level among single mothers in the United States with a correlation coefficient (R) of 0.774 and weighted average of 44.5%. Similarly, the statistical analysis conducted on geographies consisting of 329,467,597 people shows a significant positive correlation between the proportion of Pakistanis and poverty level among single mothers in the United States with a correlation coefficient (R) of 0.642 and weighted average of 28.0%, a difference of 59.3%.
Single Mother Poverty Correlation Summary
| Measurement | Puerto Rican | Pakistani |
| Minimum | 8.7% | 10.5% |
| Maximum | 100.0% | 100.0% |
| Range | 91.3% | 89.5% |
| Mean | 47.8% | 41.1% |
| Median | 40.4% | 30.5% |
| Interquartile 25% (IQ1) | 31.7% | 25.8% |
| Interquartile 75% (IQ3) | 63.4% | 52.0% |
| Interquartile Range (IQR) | 31.7% | 26.2% |
| Standard Deviation (Sample) | 20.8% | 23.5% |
| Standard Deviation (Population) | 20.8% | 23.3% |
Similar Demographics by Single Mother Poverty
Demographics Similar to Puerto Ricans by Single Mother Poverty
In terms of single mother poverty, the demographic groups most similar to Puerto Ricans are Houma (43.5%, a difference of 2.4%), Lumbee (43.2%, a difference of 3.0%), Tohono O'odham (43.0%, a difference of 3.5%), Cajun (40.3%, a difference of 10.4%), and Navajo (40.2%, a difference of 10.8%).
| Demographics | Rating | Rank | Single Mother Poverty |
| Menominee | 0.0 /100 | #333 | Tragic 37.1% |
| Pueblo | 0.0 /100 | #334 | Tragic 37.2% |
| Yuman | 0.0 /100 | #335 | Tragic 37.8% |
| Cheyenne | 0.0 /100 | #336 | Tragic 38.5% |
| Immigrants | Yemen | 0.0 /100 | #337 | Tragic 38.5% |
| Pima | 0.0 /100 | #338 | Tragic 38.6% |
| Crow | 0.0 /100 | #339 | Tragic 38.6% |
| Sioux | 0.0 /100 | #340 | Tragic 38.8% |
| Colville | 0.0 /100 | #341 | Tragic 39.3% |
| Navajo | 0.0 /100 | #342 | Tragic 40.2% |
| Cajuns | 0.0 /100 | #343 | Tragic 40.3% |
| Tohono O'odham | 0.0 /100 | #344 | Tragic 43.0% |
| Lumbee | 0.0 /100 | #345 | Tragic 43.2% |
| Houma | 0.0 /100 | #346 | Tragic 43.5% |
| Puerto Ricans | 0.0 /100 | #347 | Tragic 44.5% |
Demographics Similar to Pakistanis by Single Mother Poverty
In terms of single mother poverty, the demographic groups most similar to Pakistanis are Zimbabwean (27.9%, a difference of 0.070%), Immigrants from Croatia (28.0%, a difference of 0.10%), Immigrants from Netherlands (27.9%, a difference of 0.11%), Immigrants from Nepal (27.9%, a difference of 0.12%), and Immigrants from Northern Africa (28.0%, a difference of 0.12%).
| Demographics | Rating | Rank | Single Mother Poverty |
| Albanians | 97.6 /100 | #94 | Exceptional 27.9% |
| Chileans | 97.5 /100 | #95 | Exceptional 27.9% |
| Immigrants | Iraq | 97.3 /100 | #96 | Exceptional 27.9% |
| Immigrants | Brazil | 97.2 /100 | #97 | Exceptional 27.9% |
| Immigrants | Nepal | 97.2 /100 | #98 | Exceptional 27.9% |
| Immigrants | Netherlands | 97.2 /100 | #99 | Exceptional 27.9% |
| Zimbabweans | 97.1 /100 | #100 | Exceptional 27.9% |
| Pakistanis | 96.9 /100 | #101 | Exceptional 28.0% |
| Immigrants | Croatia | 96.7 /100 | #102 | Exceptional 28.0% |
| Immigrants | Northern Africa | 96.6 /100 | #103 | Exceptional 28.0% |
| Italians | 96.6 /100 | #104 | Exceptional 28.0% |
| Israelis | 96.5 /100 | #105 | Exceptional 28.0% |
| Ukrainians | 96.4 /100 | #106 | Exceptional 28.0% |
| Immigrants | Venezuela | 95.8 /100 | #107 | Exceptional 28.1% |
| Immigrants | Zimbabwe | 95.5 /100 | #108 | Exceptional 28.1% |