Guyanese vs Apache Single Mother Poverty
COMPARE
Guyanese
Apache
Single Mother Poverty
Single Mother Poverty Comparison
Guyanese
Apache
29.8%
SINGLE MOTHER POVERTY
12.8/ 100
METRIC RATING
211th/ 347
METRIC RANK
36.6%
SINGLE MOTHER POVERTY
0.0/ 100
METRIC RATING
329th/ 347
METRIC RANK
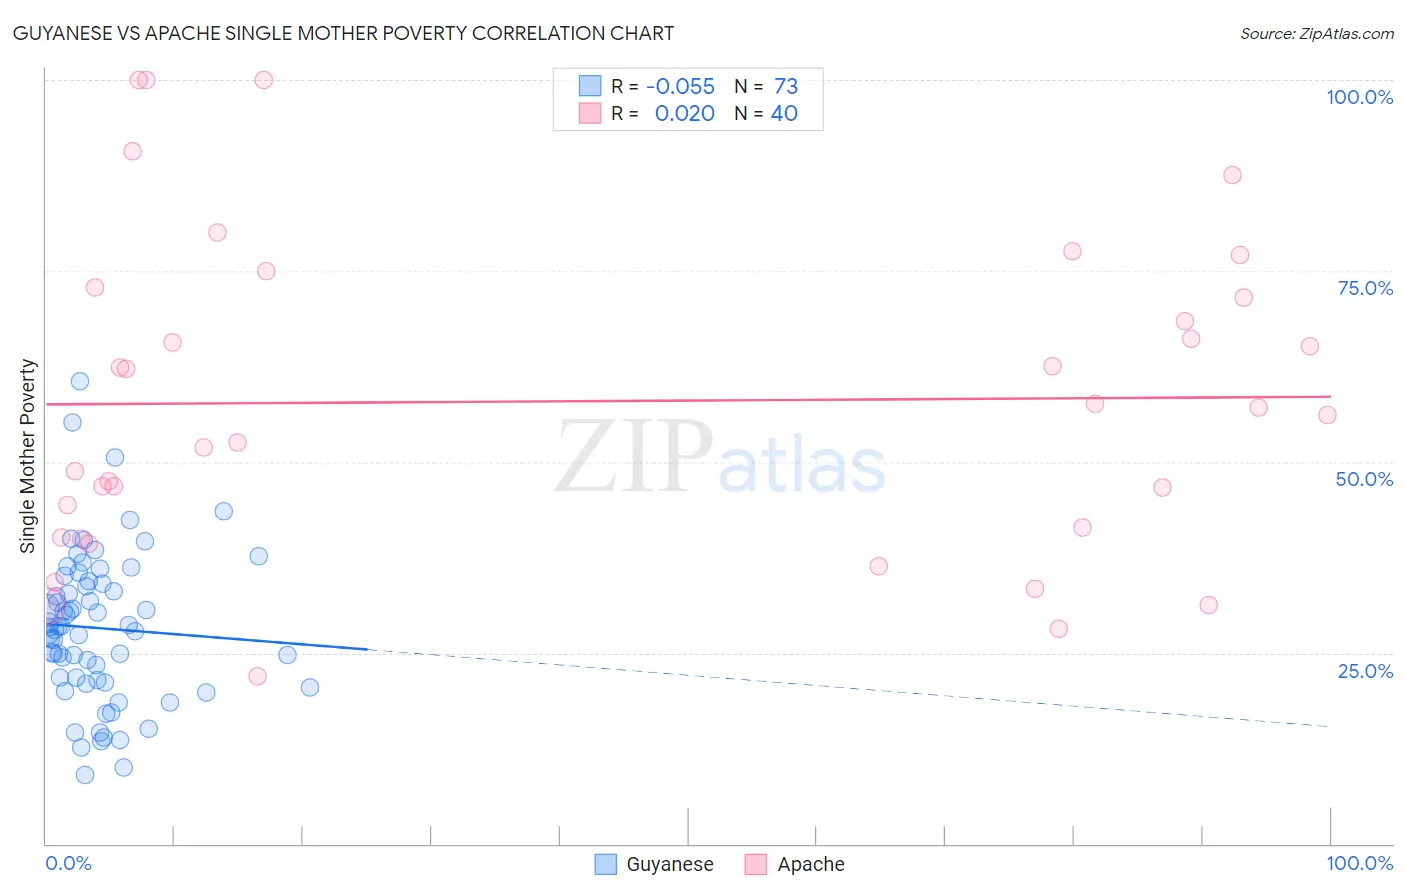
Guyanese vs Apache Single Mother Poverty Correlation Chart
The statistical analysis conducted on geographies consisting of 174,134,686 people shows a slight negative correlation between the proportion of Guyanese and poverty level among single mothers in the United States with a correlation coefficient (R) of -0.055 and weighted average of 29.8%. Similarly, the statistical analysis conducted on geographies consisting of 229,112,849 people shows no correlation between the proportion of Apache and poverty level among single mothers in the United States with a correlation coefficient (R) of 0.020 and weighted average of 36.6%, a difference of 22.6%.
Single Mother Poverty Correlation Summary
| Measurement | Guyanese | Apache |
| Minimum | 9.1% | 21.9% |
| Maximum | 60.5% | 100.0% |
| Range | 51.4% | 78.1% |
| Mean | 28.2% | 57.9% |
| Median | 28.4% | 56.6% |
| Interquartile 25% (IQ1) | 21.3% | 40.8% |
| Interquartile 75% (IQ3) | 34.2% | 72.2% |
| Interquartile Range (IQR) | 12.9% | 31.4% |
| Standard Deviation (Sample) | 9.9% | 20.8% |
| Standard Deviation (Population) | 9.9% | 20.5% |
Similar Demographics by Single Mother Poverty
Demographics Similar to Guyanese by Single Mother Poverty
In terms of single mother poverty, the demographic groups most similar to Guyanese are Nicaraguan (29.8%, a difference of 0.040%), Haitian (29.8%, a difference of 0.050%), Immigrants from Thailand (29.9%, a difference of 0.090%), Irish (29.8%, a difference of 0.11%), and Liberian (29.9%, a difference of 0.12%).
| Demographics | Rating | Rank | Single Mother Poverty |
| Immigrants | Immigrants | 16.6 /100 | #204 | Poor 29.7% |
| Czechoslovakians | 16.1 /100 | #205 | Poor 29.7% |
| Immigrants | Haiti | 15.8 /100 | #206 | Poor 29.7% |
| Immigrants | Panama | 15.5 /100 | #207 | Poor 29.8% |
| Immigrants | Guyana | 14.7 /100 | #208 | Poor 29.8% |
| Irish | 13.9 /100 | #209 | Poor 29.8% |
| Haitians | 13.3 /100 | #210 | Poor 29.8% |
| Guyanese | 12.8 /100 | #211 | Poor 29.8% |
| Nicaraguans | 12.4 /100 | #212 | Poor 29.8% |
| Immigrants | Thailand | 12.0 /100 | #213 | Poor 29.9% |
| Liberians | 11.7 /100 | #214 | Poor 29.9% |
| Jamaicans | 11.7 /100 | #215 | Poor 29.9% |
| Immigrants | Western Africa | 11.5 /100 | #216 | Poor 29.9% |
| Immigrants | Ghana | 11.3 /100 | #217 | Poor 29.9% |
| Hungarians | 10.3 /100 | #218 | Poor 29.9% |
Demographics Similar to Apache by Single Mother Poverty
In terms of single mother poverty, the demographic groups most similar to Apache are Native/Alaskan (36.6%, a difference of 0.10%), Creek (36.7%, a difference of 0.26%), Choctaw (36.4%, a difference of 0.48%), Dutch West Indian (36.8%, a difference of 0.50%), and Yakama (36.4%, a difference of 0.53%).
| Demographics | Rating | Rank | Single Mother Poverty |
| Blacks/African Americans | 0.0 /100 | #322 | Tragic 35.2% |
| Kiowa | 0.0 /100 | #323 | Tragic 35.5% |
| Ottawa | 0.0 /100 | #324 | Tragic 35.5% |
| Ute | 0.0 /100 | #325 | Tragic 35.7% |
| Seminole | 0.0 /100 | #326 | Tragic 35.8% |
| Yakama | 0.0 /100 | #327 | Tragic 36.4% |
| Choctaw | 0.0 /100 | #328 | Tragic 36.4% |
| Apache | 0.0 /100 | #329 | Tragic 36.6% |
| Natives/Alaskans | 0.0 /100 | #330 | Tragic 36.6% |
| Creek | 0.0 /100 | #331 | Tragic 36.7% |
| Dutch West Indians | 0.0 /100 | #332 | Tragic 36.8% |
| Menominee | 0.0 /100 | #333 | Tragic 37.1% |
| Pueblo | 0.0 /100 | #334 | Tragic 37.2% |
| Yuman | 0.0 /100 | #335 | Tragic 37.8% |
| Cheyenne | 0.0 /100 | #336 | Tragic 38.5% |