Puerto Rican vs Apache 8th Grade
COMPARE
Puerto Rican
Apache
8th Grade
8th Grade Comparison
Puerto Ricans
Apache
93.2%
8TH GRADE
0.0/ 100
METRIC RATING
318th/ 347
METRIC RANK
95.5%
8TH GRADE
19.4/ 100
METRIC RATING
202nd/ 347
METRIC RANK
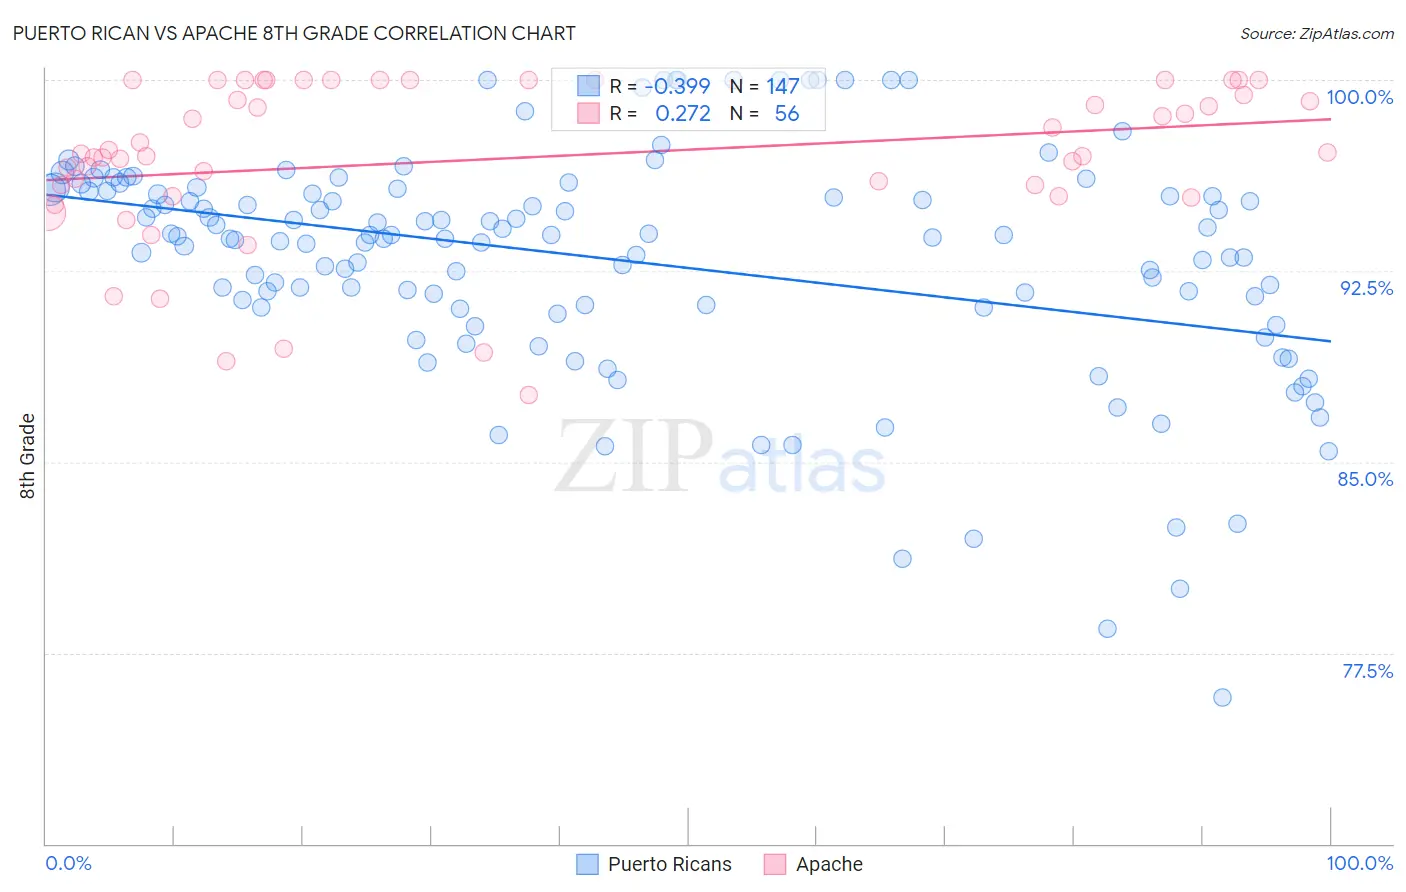
Puerto Rican vs Apache 8th Grade Correlation Chart
The statistical analysis conducted on geographies consisting of 528,320,438 people shows a mild negative correlation between the proportion of Puerto Ricans and percentage of population with at least 8th grade education in the United States with a correlation coefficient (R) of -0.399 and weighted average of 93.2%. Similarly, the statistical analysis conducted on geographies consisting of 231,143,094 people shows a weak positive correlation between the proportion of Apache and percentage of population with at least 8th grade education in the United States with a correlation coefficient (R) of 0.272 and weighted average of 95.5%, a difference of 2.4%.
8th Grade Correlation Summary
| Measurement | Puerto Rican | Apache |
| Minimum | 75.7% | 87.6% |
| Maximum | 100.0% | 100.0% |
| Range | 24.3% | 12.4% |
| Mean | 92.9% | 96.9% |
| Median | 93.8% | 97.1% |
| Interquartile 25% (IQ1) | 91.0% | 95.7% |
| Interquartile 75% (IQ3) | 95.7% | 100.0% |
| Interquartile Range (IQR) | 4.6% | 4.3% |
| Standard Deviation (Sample) | 4.5% | 3.2% |
| Standard Deviation (Population) | 4.5% | 3.1% |
Similar Demographics by 8th Grade
Demographics Similar to Puerto Ricans by 8th Grade
In terms of 8th grade, the demographic groups most similar to Puerto Ricans are Immigrants from Ecuador (93.3%, a difference of 0.010%), Immigrants from Cuba (93.2%, a difference of 0.030%), Immigrants from Cambodia (93.3%, a difference of 0.060%), Immigrants from Fiji (93.2%, a difference of 0.060%), and Belizean (93.1%, a difference of 0.19%).
| Demographics | Rating | Rank | 8th Grade |
| Immigrants | Bangladesh | 0.0 /100 | #311 | Tragic 93.6% |
| Cape Verdeans | 0.0 /100 | #312 | Tragic 93.5% |
| Immigrants | Caribbean | 0.0 /100 | #313 | Tragic 93.5% |
| Immigrants | Vietnam | 0.0 /100 | #314 | Tragic 93.5% |
| Vietnamese | 0.0 /100 | #315 | Tragic 93.5% |
| Immigrants | Cambodia | 0.0 /100 | #316 | Tragic 93.3% |
| Immigrants | Ecuador | 0.0 /100 | #317 | Tragic 93.3% |
| Puerto Ricans | 0.0 /100 | #318 | Tragic 93.2% |
| Immigrants | Cuba | 0.0 /100 | #319 | Tragic 93.2% |
| Immigrants | Fiji | 0.0 /100 | #320 | Tragic 93.2% |
| Belizeans | 0.0 /100 | #321 | Tragic 93.1% |
| Nicaraguans | 0.0 /100 | #322 | Tragic 93.0% |
| Immigrants | Belize | 0.0 /100 | #323 | Tragic 92.9% |
| Nepalese | 0.0 /100 | #324 | Tragic 92.8% |
| Dominicans | 0.0 /100 | #325 | Tragic 92.8% |
Demographics Similar to Apache by 8th Grade
In terms of 8th grade, the demographic groups most similar to Apache are Immigrants from Argentina (95.5%, a difference of 0.010%), Moroccan (95.5%, a difference of 0.020%), Paraguayan (95.5%, a difference of 0.030%), Immigrants from Northern Africa (95.5%, a difference of 0.030%), and Argentinean (95.5%, a difference of 0.030%).
| Demographics | Rating | Rank | 8th Grade |
| Immigrants | Zaire | 25.2 /100 | #195 | Fair 95.6% |
| Assyrians/Chaldeans/Syriacs | 24.5 /100 | #196 | Fair 95.6% |
| Sierra Leoneans | 24.3 /100 | #197 | Fair 95.6% |
| Paraguayans | 22.6 /100 | #198 | Fair 95.5% |
| Immigrants | Northern Africa | 22.5 /100 | #199 | Fair 95.5% |
| Argentineans | 22.2 /100 | #200 | Fair 95.5% |
| Immigrants | Argentina | 20.6 /100 | #201 | Fair 95.5% |
| Apache | 19.4 /100 | #202 | Poor 95.5% |
| Moroccans | 17.4 /100 | #203 | Poor 95.5% |
| Hawaiians | 16.7 /100 | #204 | Poor 95.5% |
| Immigrants | Bahamas | 16.7 /100 | #205 | Poor 95.5% |
| Comanche | 16.3 /100 | #206 | Poor 95.5% |
| Immigrants | Sudan | 15.1 /100 | #207 | Poor 95.5% |
| Portuguese | 14.3 /100 | #208 | Poor 95.5% |
| Immigrants | Lebanon | 13.7 /100 | #209 | Poor 95.4% |