Puerto Rican vs Apache Associate's Degree
COMPARE
Puerto Rican
Apache
Associate's Degree
Associate's Degree Comparison
Puerto Ricans
Apache
40.4%
ASSOCIATE'S DEGREE
0.1/ 100
METRIC RATING
276th/ 347
METRIC RANK
36.2%
ASSOCIATE'S DEGREE
0.0/ 100
METRIC RATING
330th/ 347
METRIC RANK
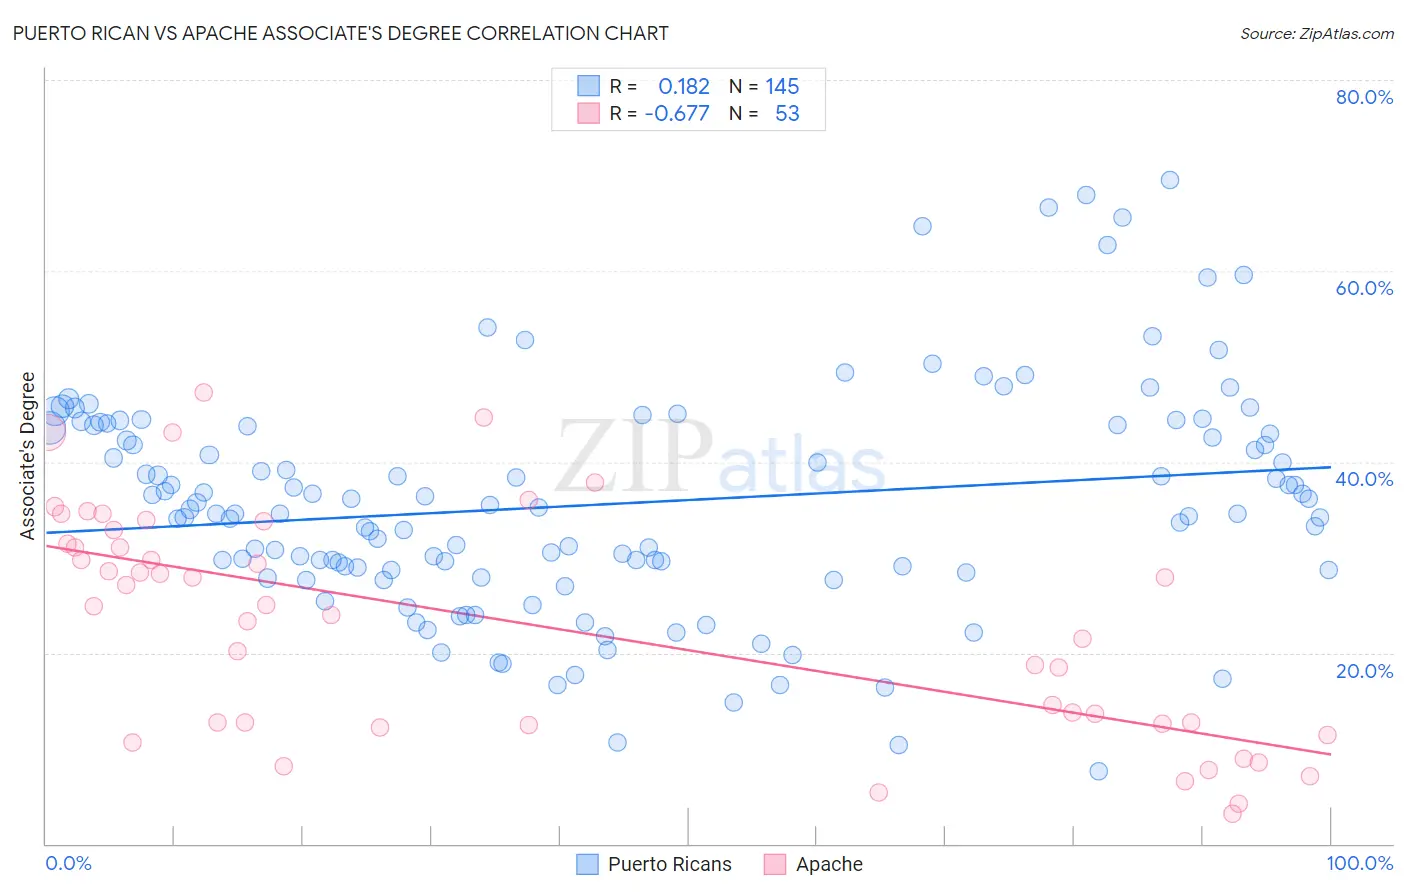
Puerto Rican vs Apache Associate's Degree Correlation Chart
The statistical analysis conducted on geographies consisting of 528,257,777 people shows a poor positive correlation between the proportion of Puerto Ricans and percentage of population with at least associate's degree education in the United States with a correlation coefficient (R) of 0.182 and weighted average of 40.4%. Similarly, the statistical analysis conducted on geographies consisting of 231,140,415 people shows a significant negative correlation between the proportion of Apache and percentage of population with at least associate's degree education in the United States with a correlation coefficient (R) of -0.677 and weighted average of 36.2%, a difference of 11.4%.
Associate's Degree Correlation Summary
| Measurement | Puerto Rican | Apache |
| Minimum | 7.5% | 3.2% |
| Maximum | 69.5% | 47.2% |
| Range | 61.9% | 44.0% |
| Mean | 35.6% | 23.0% |
| Median | 34.6% | 24.9% |
| Interquartile 25% (IQ1) | 28.7% | 12.5% |
| Interquartile 75% (IQ3) | 43.8% | 32.1% |
| Interquartile Range (IQR) | 15.1% | 19.6% |
| Standard Deviation (Sample) | 11.8% | 11.9% |
| Standard Deviation (Population) | 11.8% | 11.7% |
Similar Demographics by Associate's Degree
Demographics Similar to Puerto Ricans by Associate's Degree
In terms of associate's degree, the demographic groups most similar to Puerto Ricans are Blackfeet (40.3%, a difference of 0.050%), Potawatomi (40.4%, a difference of 0.10%), Ottawa (40.3%, a difference of 0.20%), Immigrants from Nicaragua (40.3%, a difference of 0.24%), and Immigrants from Dominica (40.5%, a difference of 0.25%).
| Demographics | Rating | Rank | Associate's Degree |
| Americans | 0.2 /100 | #269 | Tragic 40.8% |
| Chippewa | 0.2 /100 | #270 | Tragic 40.7% |
| Immigrants | Laos | 0.1 /100 | #271 | Tragic 40.7% |
| Belizeans | 0.1 /100 | #272 | Tragic 40.6% |
| Puget Sound Salish | 0.1 /100 | #273 | Tragic 40.5% |
| Immigrants | Dominica | 0.1 /100 | #274 | Tragic 40.5% |
| Potawatomi | 0.1 /100 | #275 | Tragic 40.4% |
| Puerto Ricans | 0.1 /100 | #276 | Tragic 40.4% |
| Blackfeet | 0.1 /100 | #277 | Tragic 40.3% |
| Ottawa | 0.1 /100 | #278 | Tragic 40.3% |
| Immigrants | Nicaragua | 0.1 /100 | #279 | Tragic 40.3% |
| Immigrants | Micronesia | 0.1 /100 | #280 | Tragic 40.2% |
| Immigrants | Portugal | 0.1 /100 | #281 | Tragic 40.1% |
| Bangladeshis | 0.1 /100 | #282 | Tragic 40.0% |
| Haitians | 0.1 /100 | #283 | Tragic 40.0% |
Demographics Similar to Apache by Associate's Degree
In terms of associate's degree, the demographic groups most similar to Apache are Paiute (36.4%, a difference of 0.31%), Alaskan Athabascan (36.5%, a difference of 0.60%), Dutch West Indian (36.5%, a difference of 0.61%), Kiowa (36.5%, a difference of 0.63%), and Menominee (36.7%, a difference of 1.2%).
| Demographics | Rating | Rank | Associate's Degree |
| Immigrants | Cabo Verde | 0.0 /100 | #323 | Tragic 36.8% |
| Arapaho | 0.0 /100 | #324 | Tragic 36.7% |
| Menominee | 0.0 /100 | #325 | Tragic 36.7% |
| Kiowa | 0.0 /100 | #326 | Tragic 36.5% |
| Dutch West Indians | 0.0 /100 | #327 | Tragic 36.5% |
| Alaskan Athabascans | 0.0 /100 | #328 | Tragic 36.5% |
| Paiute | 0.0 /100 | #329 | Tragic 36.4% |
| Apache | 0.0 /100 | #330 | Tragic 36.2% |
| Immigrants | Azores | 0.0 /100 | #331 | Tragic 35.6% |
| Immigrants | Central America | 0.0 /100 | #332 | Tragic 35.0% |
| Mexicans | 0.0 /100 | #333 | Tragic 35.0% |
| Natives/Alaskans | 0.0 /100 | #334 | Tragic 34.9% |
| Spanish American Indians | 0.0 /100 | #335 | Tragic 34.9% |
| Hopi | 0.0 /100 | #336 | Tragic 34.6% |
| Lumbee | 0.0 /100 | #337 | Tragic 34.1% |