Vietnamese vs Immigrants from Sierra Leone Poverty
COMPARE
Vietnamese
Immigrants from Sierra Leone
Poverty
Poverty Comparison
Vietnamese
Immigrants from Sierra Leone
15.0%
POVERTY
0.0/ 100
METRIC RATING
285th/ 347
METRIC RANK
12.5%
POVERTY
36.3/ 100
METRIC RATING
186th/ 347
METRIC RANK
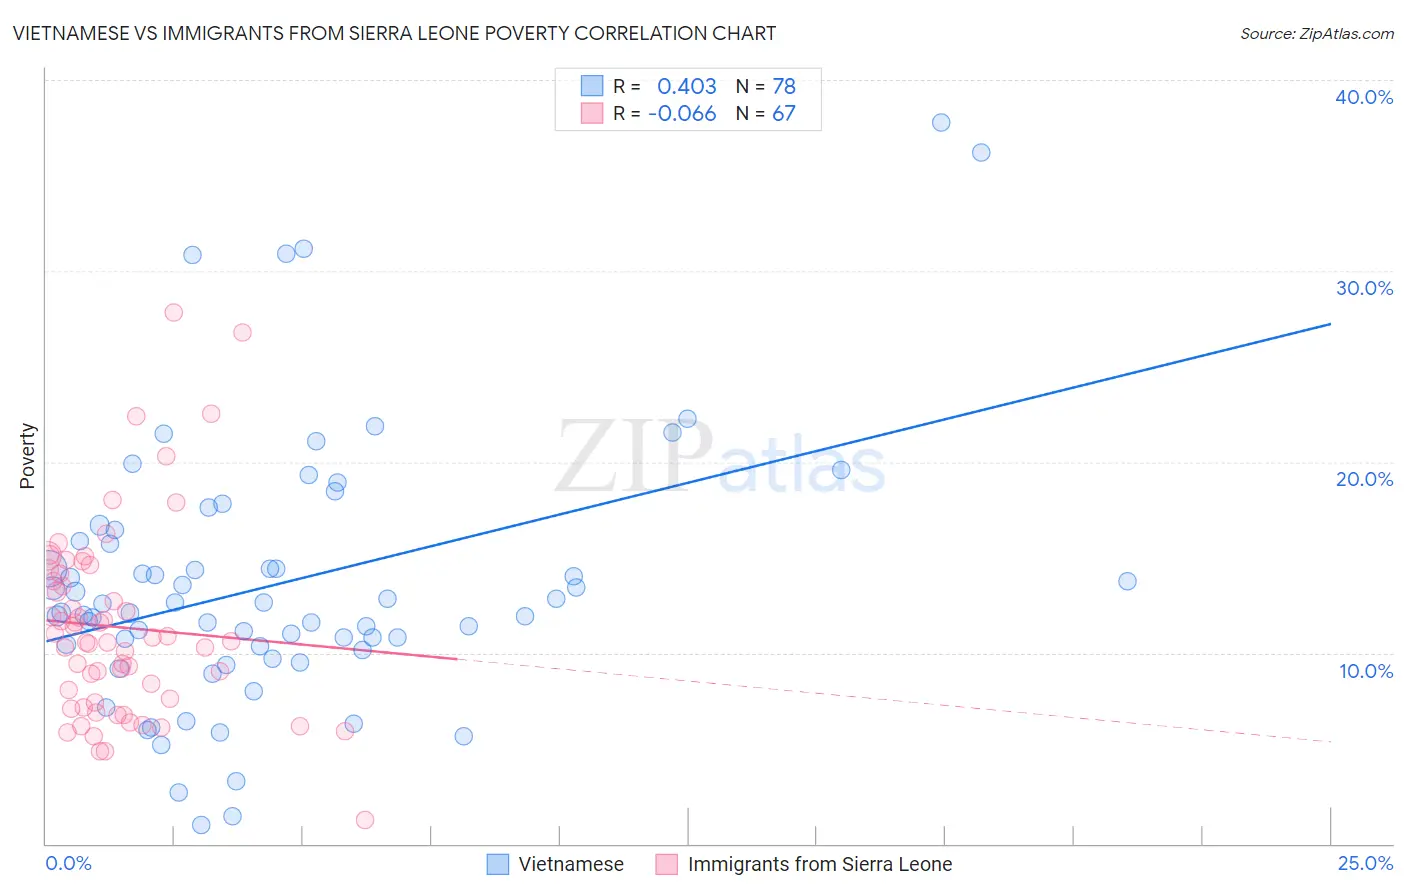
Vietnamese vs Immigrants from Sierra Leone Poverty Correlation Chart
The statistical analysis conducted on geographies consisting of 170,677,568 people shows a moderate positive correlation between the proportion of Vietnamese and poverty level in the United States with a correlation coefficient (R) of 0.403 and weighted average of 15.0%. Similarly, the statistical analysis conducted on geographies consisting of 101,642,850 people shows a slight negative correlation between the proportion of Immigrants from Sierra Leone and poverty level in the United States with a correlation coefficient (R) of -0.066 and weighted average of 12.5%, a difference of 20.1%.
Poverty Correlation Summary
| Measurement | Vietnamese | Immigrants from Sierra Leone |
| Minimum | 1.0% | 1.3% |
| Maximum | 37.7% | 27.8% |
| Range | 36.7% | 26.5% |
| Mean | 13.6% | 11.3% |
| Median | 12.3% | 10.6% |
| Interquartile 25% (IQ1) | 10.4% | 7.4% |
| Interquartile 75% (IQ3) | 15.9% | 14.2% |
| Interquartile Range (IQR) | 5.5% | 6.8% |
| Standard Deviation (Sample) | 7.0% | 5.0% |
| Standard Deviation (Population) | 7.0% | 5.0% |
Similar Demographics by Poverty
Demographics Similar to Vietnamese by Poverty
In terms of poverty, the demographic groups most similar to Vietnamese are West Indian (15.0%, a difference of 0.050%), Immigrants from Haiti (15.0%, a difference of 0.16%), Immigrants from Latin America (15.0%, a difference of 0.26%), Comanche (15.0%, a difference of 0.28%), and Inupiat (15.1%, a difference of 0.47%).
| Demographics | Rating | Rank | Poverty |
| Belizeans | 0.0 /100 | #278 | Tragic 14.8% |
| Immigrants | St. Vincent and the Grenadines | 0.0 /100 | #279 | Tragic 14.9% |
| Haitians | 0.0 /100 | #280 | Tragic 14.9% |
| Immigrants | Barbados | 0.0 /100 | #281 | Tragic 14.9% |
| Comanche | 0.0 /100 | #282 | Tragic 15.0% |
| Immigrants | Haiti | 0.0 /100 | #283 | Tragic 15.0% |
| West Indians | 0.0 /100 | #284 | Tragic 15.0% |
| Vietnamese | 0.0 /100 | #285 | Tragic 15.0% |
| Immigrants | Latin America | 0.0 /100 | #286 | Tragic 15.0% |
| Inupiat | 0.0 /100 | #287 | Tragic 15.1% |
| Yaqui | 0.0 /100 | #288 | Tragic 15.1% |
| Immigrants | Belize | 0.0 /100 | #289 | Tragic 15.1% |
| Mexicans | 0.0 /100 | #290 | Tragic 15.1% |
| Immigrants | Cabo Verde | 0.0 /100 | #291 | Tragic 15.1% |
| Indonesians | 0.0 /100 | #292 | Tragic 15.1% |
Demographics Similar to Immigrants from Sierra Leone by Poverty
In terms of poverty, the demographic groups most similar to Immigrants from Sierra Leone are Israeli (12.5%, a difference of 0.020%), Hawaiian (12.5%, a difference of 0.23%), Kenyan (12.5%, a difference of 0.26%), Immigrants from Costa Rica (12.5%, a difference of 0.32%), and Aleut (12.5%, a difference of 0.32%).
| Demographics | Rating | Rank | Poverty |
| Immigrants | Morocco | 44.0 /100 | #179 | Average 12.4% |
| Mongolians | 43.6 /100 | #180 | Average 12.4% |
| Immigrants | Afghanistan | 42.1 /100 | #181 | Average 12.4% |
| Immigrants | Cameroon | 41.7 /100 | #182 | Average 12.4% |
| Immigrants | Iraq | 40.2 /100 | #183 | Average 12.4% |
| Kenyans | 38.8 /100 | #184 | Fair 12.5% |
| Israelis | 36.4 /100 | #185 | Fair 12.5% |
| Immigrants | Sierra Leone | 36.3 /100 | #186 | Fair 12.5% |
| Hawaiians | 34.1 /100 | #187 | Fair 12.5% |
| Immigrants | Costa Rica | 33.3 /100 | #188 | Fair 12.5% |
| Aleuts | 33.2 /100 | #189 | Fair 12.5% |
| Immigrants | South America | 32.3 /100 | #190 | Fair 12.5% |
| Sierra Leoneans | 31.5 /100 | #191 | Fair 12.6% |
| South American Indians | 23.3 /100 | #192 | Fair 12.7% |
| Delaware | 21.4 /100 | #193 | Fair 12.7% |