Jordanian vs Immigrants from Sierra Leone Poverty
COMPARE
Jordanian
Immigrants from Sierra Leone
Poverty
Poverty Comparison
Jordanians
Immigrants from Sierra Leone
11.4%
POVERTY
96.0/ 100
METRIC RATING
86th/ 347
METRIC RANK
12.5%
POVERTY
36.3/ 100
METRIC RATING
186th/ 347
METRIC RANK
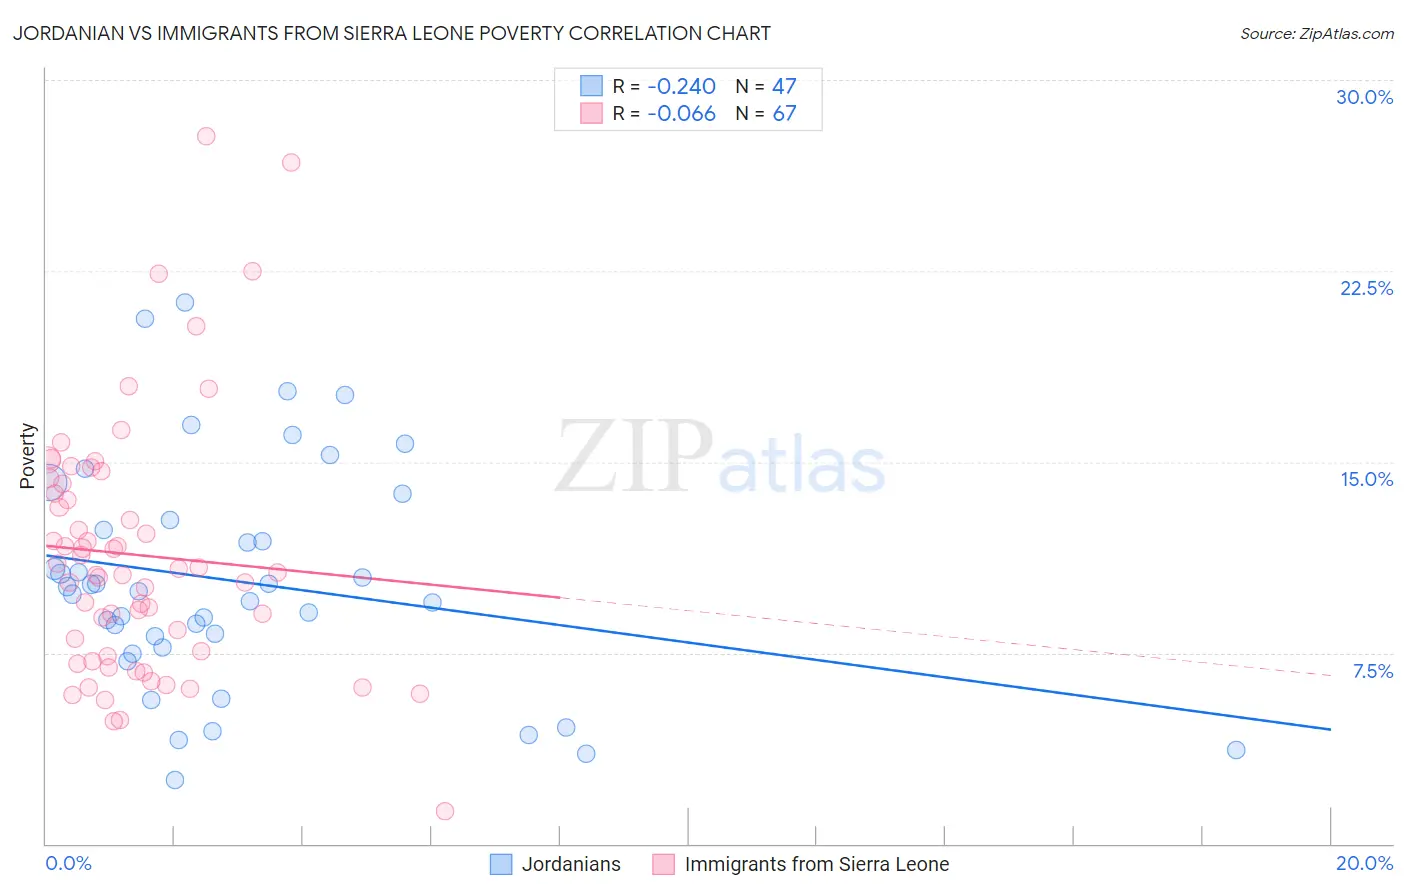
Jordanian vs Immigrants from Sierra Leone Poverty Correlation Chart
The statistical analysis conducted on geographies consisting of 166,402,418 people shows a weak negative correlation between the proportion of Jordanians and poverty level in the United States with a correlation coefficient (R) of -0.240 and weighted average of 11.4%. Similarly, the statistical analysis conducted on geographies consisting of 101,642,850 people shows a slight negative correlation between the proportion of Immigrants from Sierra Leone and poverty level in the United States with a correlation coefficient (R) of -0.066 and weighted average of 12.5%, a difference of 9.8%.
Poverty Correlation Summary
| Measurement | Jordanian | Immigrants from Sierra Leone |
| Minimum | 2.5% | 1.3% |
| Maximum | 21.3% | 27.8% |
| Range | 18.7% | 26.5% |
| Mean | 10.3% | 11.3% |
| Median | 9.9% | 10.6% |
| Interquartile 25% (IQ1) | 7.7% | 7.4% |
| Interquartile 75% (IQ3) | 12.7% | 14.2% |
| Interquartile Range (IQR) | 5.0% | 6.8% |
| Standard Deviation (Sample) | 4.4% | 5.0% |
| Standard Deviation (Population) | 4.4% | 5.0% |
Similar Demographics by Poverty
Demographics Similar to Jordanians by Poverty
In terms of poverty, the demographic groups most similar to Jordanians are Northern European (11.4%, a difference of 0.0%), Immigrants from England (11.4%, a difference of 0.12%), Belgian (11.4%, a difference of 0.14%), English (11.3%, a difference of 0.18%), and Czechoslovakian (11.4%, a difference of 0.18%).
| Demographics | Rating | Rank | Poverty |
| Cambodians | 96.7 /100 | #79 | Exceptional 11.3% |
| Indians (Asian) | 96.6 /100 | #80 | Exceptional 11.3% |
| Irish | 96.6 /100 | #81 | Exceptional 11.3% |
| Egyptians | 96.5 /100 | #82 | Exceptional 11.3% |
| Immigrants | Sweden | 96.3 /100 | #83 | Exceptional 11.3% |
| English | 96.3 /100 | #84 | Exceptional 11.3% |
| Immigrants | England | 96.2 /100 | #85 | Exceptional 11.4% |
| Jordanians | 96.0 /100 | #86 | Exceptional 11.4% |
| Northern Europeans | 96.0 /100 | #87 | Exceptional 11.4% |
| Belgians | 95.8 /100 | #88 | Exceptional 11.4% |
| Czechoslovakians | 95.7 /100 | #89 | Exceptional 11.4% |
| Immigrants | Denmark | 95.5 /100 | #90 | Exceptional 11.4% |
| Finns | 95.2 /100 | #91 | Exceptional 11.4% |
| British | 95.0 /100 | #92 | Exceptional 11.4% |
| Romanians | 94.9 /100 | #93 | Exceptional 11.4% |
Demographics Similar to Immigrants from Sierra Leone by Poverty
In terms of poverty, the demographic groups most similar to Immigrants from Sierra Leone are Israeli (12.5%, a difference of 0.020%), Hawaiian (12.5%, a difference of 0.23%), Kenyan (12.5%, a difference of 0.26%), Immigrants from Costa Rica (12.5%, a difference of 0.32%), and Aleut (12.5%, a difference of 0.32%).
| Demographics | Rating | Rank | Poverty |
| Immigrants | Morocco | 44.0 /100 | #179 | Average 12.4% |
| Mongolians | 43.6 /100 | #180 | Average 12.4% |
| Immigrants | Afghanistan | 42.1 /100 | #181 | Average 12.4% |
| Immigrants | Cameroon | 41.7 /100 | #182 | Average 12.4% |
| Immigrants | Iraq | 40.2 /100 | #183 | Average 12.4% |
| Kenyans | 38.8 /100 | #184 | Fair 12.5% |
| Israelis | 36.4 /100 | #185 | Fair 12.5% |
| Immigrants | Sierra Leone | 36.3 /100 | #186 | Fair 12.5% |
| Hawaiians | 34.1 /100 | #187 | Fair 12.5% |
| Immigrants | Costa Rica | 33.3 /100 | #188 | Fair 12.5% |
| Aleuts | 33.2 /100 | #189 | Fair 12.5% |
| Immigrants | South America | 32.3 /100 | #190 | Fair 12.5% |
| Sierra Leoneans | 31.5 /100 | #191 | Fair 12.6% |
| South American Indians | 23.3 /100 | #192 | Fair 12.7% |
| Delaware | 21.4 /100 | #193 | Fair 12.7% |