Immigrants from Sweden vs Immigrants from Sierra Leone Poverty
COMPARE
Immigrants from Sweden
Immigrants from Sierra Leone
Poverty
Poverty Comparison
Immigrants from Sweden
Immigrants from Sierra Leone
11.3%
POVERTY
96.3/ 100
METRIC RATING
83rd/ 347
METRIC RANK
12.5%
POVERTY
36.3/ 100
METRIC RATING
186th/ 347
METRIC RANK
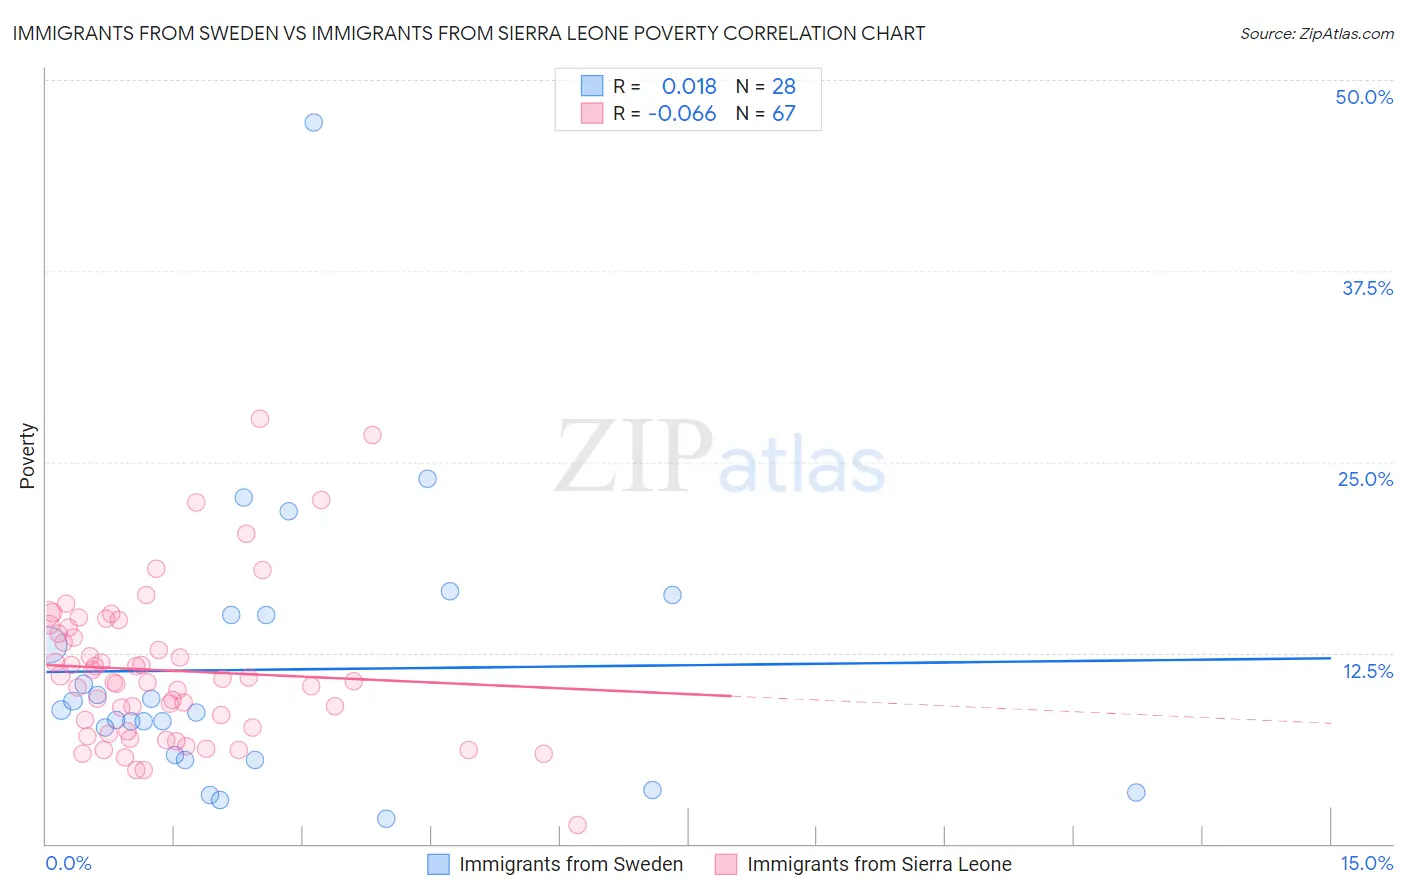
Immigrants from Sweden vs Immigrants from Sierra Leone Poverty Correlation Chart
The statistical analysis conducted on geographies consisting of 164,694,810 people shows no correlation between the proportion of Immigrants from Sweden and poverty level in the United States with a correlation coefficient (R) of 0.018 and weighted average of 11.3%. Similarly, the statistical analysis conducted on geographies consisting of 101,642,850 people shows a slight negative correlation between the proportion of Immigrants from Sierra Leone and poverty level in the United States with a correlation coefficient (R) of -0.066 and weighted average of 12.5%, a difference of 10.0%.
Poverty Correlation Summary
| Measurement | Immigrants from Sweden | Immigrants from Sierra Leone |
| Minimum | 1.7% | 1.3% |
| Maximum | 47.2% | 27.8% |
| Range | 45.6% | 26.5% |
| Mean | 11.4% | 11.3% |
| Median | 8.7% | 10.6% |
| Interquartile 25% (IQ1) | 5.7% | 7.4% |
| Interquartile 75% (IQ3) | 15.0% | 14.2% |
| Interquartile Range (IQR) | 9.3% | 6.8% |
| Standard Deviation (Sample) | 9.2% | 5.0% |
| Standard Deviation (Population) | 9.1% | 5.0% |
Similar Demographics by Poverty
Demographics Similar to Immigrants from Sweden by Poverty
In terms of poverty, the demographic groups most similar to Immigrants from Sweden are English (11.3%, a difference of 0.010%), Immigrants from England (11.4%, a difference of 0.080%), Egyptian (11.3%, a difference of 0.18%), Jordanian (11.4%, a difference of 0.19%), and Northern European (11.4%, a difference of 0.20%).
| Demographics | Rating | Rank | Poverty |
| Immigrants | North America | 96.8 /100 | #76 | Exceptional 11.3% |
| Immigrants | Eastern Asia | 96.7 /100 | #77 | Exceptional 11.3% |
| Dutch | 96.7 /100 | #78 | Exceptional 11.3% |
| Cambodians | 96.7 /100 | #79 | Exceptional 11.3% |
| Indians (Asian) | 96.6 /100 | #80 | Exceptional 11.3% |
| Irish | 96.6 /100 | #81 | Exceptional 11.3% |
| Egyptians | 96.5 /100 | #82 | Exceptional 11.3% |
| Immigrants | Sweden | 96.3 /100 | #83 | Exceptional 11.3% |
| English | 96.3 /100 | #84 | Exceptional 11.3% |
| Immigrants | England | 96.2 /100 | #85 | Exceptional 11.4% |
| Jordanians | 96.0 /100 | #86 | Exceptional 11.4% |
| Northern Europeans | 96.0 /100 | #87 | Exceptional 11.4% |
| Belgians | 95.8 /100 | #88 | Exceptional 11.4% |
| Czechoslovakians | 95.7 /100 | #89 | Exceptional 11.4% |
| Immigrants | Denmark | 95.5 /100 | #90 | Exceptional 11.4% |
Demographics Similar to Immigrants from Sierra Leone by Poverty
In terms of poverty, the demographic groups most similar to Immigrants from Sierra Leone are Israeli (12.5%, a difference of 0.020%), Hawaiian (12.5%, a difference of 0.23%), Kenyan (12.5%, a difference of 0.26%), Immigrants from Costa Rica (12.5%, a difference of 0.32%), and Aleut (12.5%, a difference of 0.32%).
| Demographics | Rating | Rank | Poverty |
| Immigrants | Morocco | 44.0 /100 | #179 | Average 12.4% |
| Mongolians | 43.6 /100 | #180 | Average 12.4% |
| Immigrants | Afghanistan | 42.1 /100 | #181 | Average 12.4% |
| Immigrants | Cameroon | 41.7 /100 | #182 | Average 12.4% |
| Immigrants | Iraq | 40.2 /100 | #183 | Average 12.4% |
| Kenyans | 38.8 /100 | #184 | Fair 12.5% |
| Israelis | 36.4 /100 | #185 | Fair 12.5% |
| Immigrants | Sierra Leone | 36.3 /100 | #186 | Fair 12.5% |
| Hawaiians | 34.1 /100 | #187 | Fair 12.5% |
| Immigrants | Costa Rica | 33.3 /100 | #188 | Fair 12.5% |
| Aleuts | 33.2 /100 | #189 | Fair 12.5% |
| Immigrants | South America | 32.3 /100 | #190 | Fair 12.5% |
| Sierra Leoneans | 31.5 /100 | #191 | Fair 12.6% |
| South American Indians | 23.3 /100 | #192 | Fair 12.7% |
| Delaware | 21.4 /100 | #193 | Fair 12.7% |