Immigrants from Eastern Africa vs Immigrants from Sierra Leone Poverty
COMPARE
Immigrants from Eastern Africa
Immigrants from Sierra Leone
Poverty
Poverty Comparison
Immigrants from Eastern Africa
Immigrants from Sierra Leone
13.1%
POVERTY
7.0/ 100
METRIC RATING
206th/ 347
METRIC RANK
12.5%
POVERTY
36.3/ 100
METRIC RATING
186th/ 347
METRIC RANK
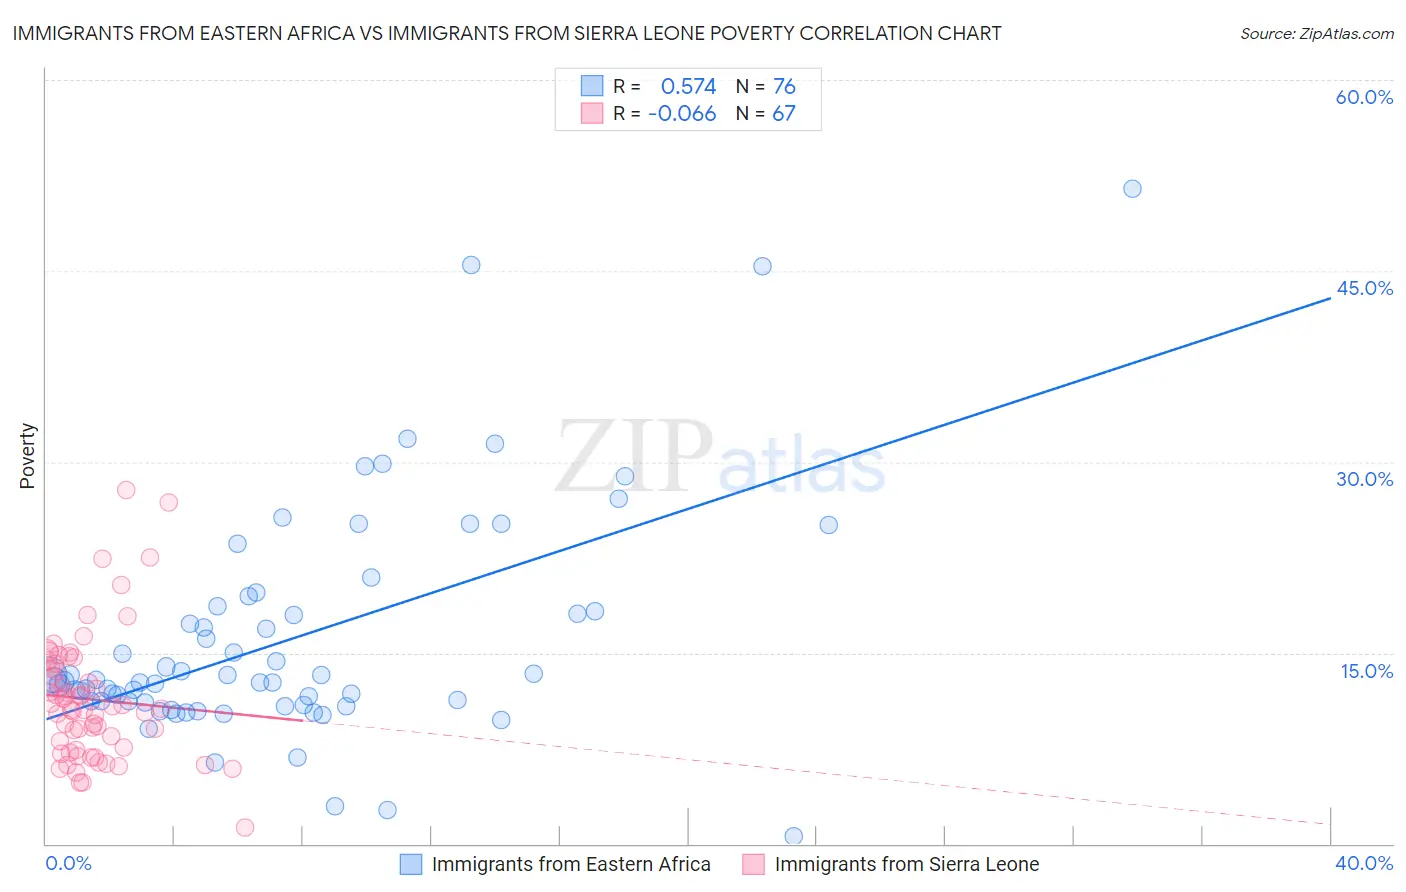
Immigrants from Eastern Africa vs Immigrants from Sierra Leone Poverty Correlation Chart
The statistical analysis conducted on geographies consisting of 354,926,881 people shows a substantial positive correlation between the proportion of Immigrants from Eastern Africa and poverty level in the United States with a correlation coefficient (R) of 0.574 and weighted average of 13.1%. Similarly, the statistical analysis conducted on geographies consisting of 101,642,850 people shows a slight negative correlation between the proportion of Immigrants from Sierra Leone and poverty level in the United States with a correlation coefficient (R) of -0.066 and weighted average of 12.5%, a difference of 4.9%.
Poverty Correlation Summary
| Measurement | Immigrants from Eastern Africa | Immigrants from Sierra Leone |
| Minimum | 0.57% | 1.3% |
| Maximum | 51.5% | 27.8% |
| Range | 50.9% | 26.5% |
| Mean | 16.1% | 11.3% |
| Median | 12.8% | 10.6% |
| Interquartile 25% (IQ1) | 11.1% | 7.4% |
| Interquartile 75% (IQ3) | 18.5% | 14.2% |
| Interquartile Range (IQR) | 7.4% | 6.8% |
| Standard Deviation (Sample) | 9.2% | 5.0% |
| Standard Deviation (Population) | 9.1% | 5.0% |
Demographics Similar to Immigrants from Eastern Africa and Immigrants from Sierra Leone by Poverty
In terms of poverty, the demographic groups most similar to Immigrants from Eastern Africa are Tsimshian (13.0%, a difference of 0.70%), Immigrants from Western Asia (12.9%, a difference of 1.8%), Hmong (12.8%, a difference of 2.0%), Immigrants from Uruguay (12.8%, a difference of 2.1%), and Spaniard (12.8%, a difference of 2.3%). Similarly, the demographic groups most similar to Immigrants from Sierra Leone are Hawaiian (12.5%, a difference of 0.23%), Immigrants from Costa Rica (12.5%, a difference of 0.32%), Aleut (12.5%, a difference of 0.32%), Immigrants from South America (12.5%, a difference of 0.41%), and Sierra Leonean (12.6%, a difference of 0.51%).
| Demographics | Rating | Rank | Poverty |
| Immigrants | Sierra Leone | 36.3 /100 | #186 | Fair 12.5% |
| Hawaiians | 34.1 /100 | #187 | Fair 12.5% |
| Immigrants | Costa Rica | 33.3 /100 | #188 | Fair 12.5% |
| Aleuts | 33.2 /100 | #189 | Fair 12.5% |
| Immigrants | South America | 32.3 /100 | #190 | Fair 12.5% |
| Sierra Leoneans | 31.5 /100 | #191 | Fair 12.6% |
| South American Indians | 23.3 /100 | #192 | Fair 12.7% |
| Delaware | 21.4 /100 | #193 | Fair 12.7% |
| Arabs | 21.1 /100 | #194 | Fair 12.7% |
| Immigrants | Kuwait | 20.9 /100 | #195 | Fair 12.7% |
| Iraqis | 20.8 /100 | #196 | Fair 12.7% |
| Immigrants | Lebanon | 18.7 /100 | #197 | Poor 12.8% |
| Spanish | 18.7 /100 | #198 | Poor 12.8% |
| Immigrants | Kenya | 17.5 /100 | #199 | Poor 12.8% |
| Spaniards | 16.5 /100 | #200 | Poor 12.8% |
| Immigrants | Uganda | 16.5 /100 | #201 | Poor 12.8% |
| Immigrants | Uruguay | 15.6 /100 | #202 | Poor 12.8% |
| Hmong | 15.0 /100 | #203 | Poor 12.8% |
| Immigrants | Western Asia | 14.1 /100 | #204 | Poor 12.9% |
| Tsimshian | 9.2 /100 | #205 | Tragic 13.0% |
| Immigrants | Eastern Africa | 7.0 /100 | #206 | Tragic 13.1% |