Bermudan vs Immigrants from Portugal Poverty
COMPARE
Bermudan
Immigrants from Portugal
Poverty
Poverty Comparison
Bermudans
Immigrants from Portugal
13.3%
POVERTY
3.7/ 100
METRIC RATING
214th/ 347
METRIC RANK
12.3%
POVERTY
50.5/ 100
METRIC RATING
172nd/ 347
METRIC RANK
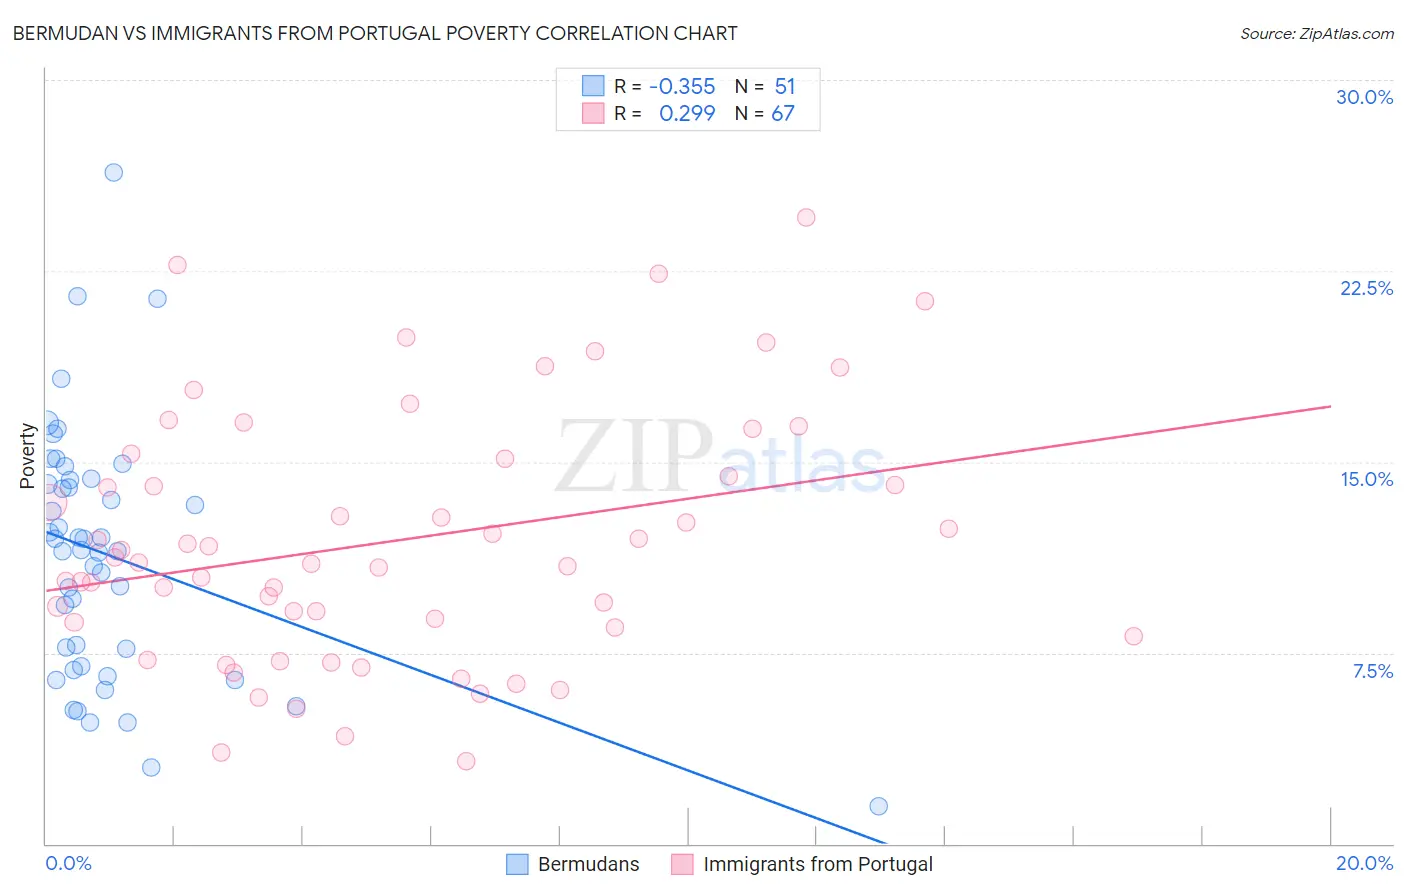
Bermudan vs Immigrants from Portugal Poverty Correlation Chart
The statistical analysis conducted on geographies consisting of 55,716,155 people shows a mild negative correlation between the proportion of Bermudans and poverty level in the United States with a correlation coefficient (R) of -0.355 and weighted average of 13.3%. Similarly, the statistical analysis conducted on geographies consisting of 174,738,655 people shows a weak positive correlation between the proportion of Immigrants from Portugal and poverty level in the United States with a correlation coefficient (R) of 0.299 and weighted average of 12.3%, a difference of 8.0%.
Poverty Correlation Summary
| Measurement | Bermudan | Immigrants from Portugal |
| Minimum | 1.5% | 3.3% |
| Maximum | 26.3% | 24.6% |
| Range | 24.9% | 21.3% |
| Mean | 11.3% | 11.9% |
| Median | 11.5% | 11.0% |
| Interquartile 25% (IQ1) | 7.0% | 8.5% |
| Interquartile 75% (IQ3) | 14.3% | 15.1% |
| Interquartile Range (IQR) | 7.3% | 6.6% |
| Standard Deviation (Sample) | 4.9% | 4.9% |
| Standard Deviation (Population) | 4.9% | 4.9% |
Similar Demographics by Poverty
Demographics Similar to Bermudans by Poverty
In terms of poverty, the demographic groups most similar to Bermudans are Immigrants from Panama (13.3%, a difference of 0.25%), Japanese (13.3%, a difference of 0.26%), Nonimmigrants (13.3%, a difference of 0.26%), Immigrants from Uzbekistan (13.3%, a difference of 0.30%), and Immigrants from Thailand (13.3%, a difference of 0.36%).
| Demographics | Rating | Rank | Poverty |
| Panamanians | 6.6 /100 | #207 | Tragic 13.1% |
| Ugandans | 6.2 /100 | #208 | Tragic 13.1% |
| Malaysians | 6.1 /100 | #209 | Tragic 13.1% |
| Immigrants | Azores | 6.1 /100 | #210 | Tragic 13.1% |
| Moroccans | 5.2 /100 | #211 | Tragic 13.2% |
| Immigrants | Immigrants | 4.3 /100 | #212 | Tragic 13.2% |
| Immigrants | Panama | 4.1 /100 | #213 | Tragic 13.3% |
| Bermudans | 3.7 /100 | #214 | Tragic 13.3% |
| Japanese | 3.3 /100 | #215 | Tragic 13.3% |
| Immigrants | Nonimmigrants | 3.3 /100 | #216 | Tragic 13.3% |
| Immigrants | Uzbekistan | 3.2 /100 | #217 | Tragic 13.3% |
| Immigrants | Thailand | 3.1 /100 | #218 | Tragic 13.3% |
| Immigrants | Cambodia | 3.0 /100 | #219 | Tragic 13.4% |
| Americans | 2.9 /100 | #220 | Tragic 13.4% |
| Alsatians | 2.6 /100 | #221 | Tragic 13.4% |
Demographics Similar to Immigrants from Portugal by Poverty
In terms of poverty, the demographic groups most similar to Immigrants from Portugal are Celtic (12.3%, a difference of 0.040%), Lebanese (12.3%, a difference of 0.050%), Immigrants from Spain (12.3%, a difference of 0.070%), South American (12.3%, a difference of 0.18%), and Immigrants from Colombia (12.3%, a difference of 0.28%).
| Demographics | Rating | Rank | Poverty |
| Immigrants | Albania | 57.7 /100 | #165 | Average 12.2% |
| Venezuelans | 56.9 /100 | #166 | Average 12.2% |
| Immigrants | Chile | 56.7 /100 | #167 | Average 12.2% |
| Immigrants | Venezuela | 56.5 /100 | #168 | Average 12.2% |
| Whites/Caucasians | 55.4 /100 | #169 | Average 12.3% |
| Immigrants | Oceania | 54.6 /100 | #170 | Average 12.3% |
| Immigrants | Spain | 51.3 /100 | #171 | Average 12.3% |
| Immigrants | Portugal | 50.5 /100 | #172 | Average 12.3% |
| Celtics | 50.1 /100 | #173 | Average 12.3% |
| Lebanese | 50.0 /100 | #174 | Average 12.3% |
| South Americans | 48.7 /100 | #175 | Average 12.3% |
| Immigrants | Colombia | 47.7 /100 | #176 | Average 12.3% |
| Immigrants | Syria | 47.5 /100 | #177 | Average 12.3% |
| Uruguayans | 44.7 /100 | #178 | Average 12.4% |
| Immigrants | Morocco | 44.0 /100 | #179 | Average 12.4% |