Palestinian vs Immigrants from Portugal Per Capita Income
COMPARE
Palestinian
Immigrants from Portugal
Per Capita Income
Per Capita Income Comparison
Palestinians
Immigrants from Portugal
$45,790
PER CAPITA INCOME
91.6/ 100
METRIC RATING
126th/ 347
METRIC RANK
$42,412
PER CAPITA INCOME
19.7/ 100
METRIC RATING
198th/ 347
METRIC RANK
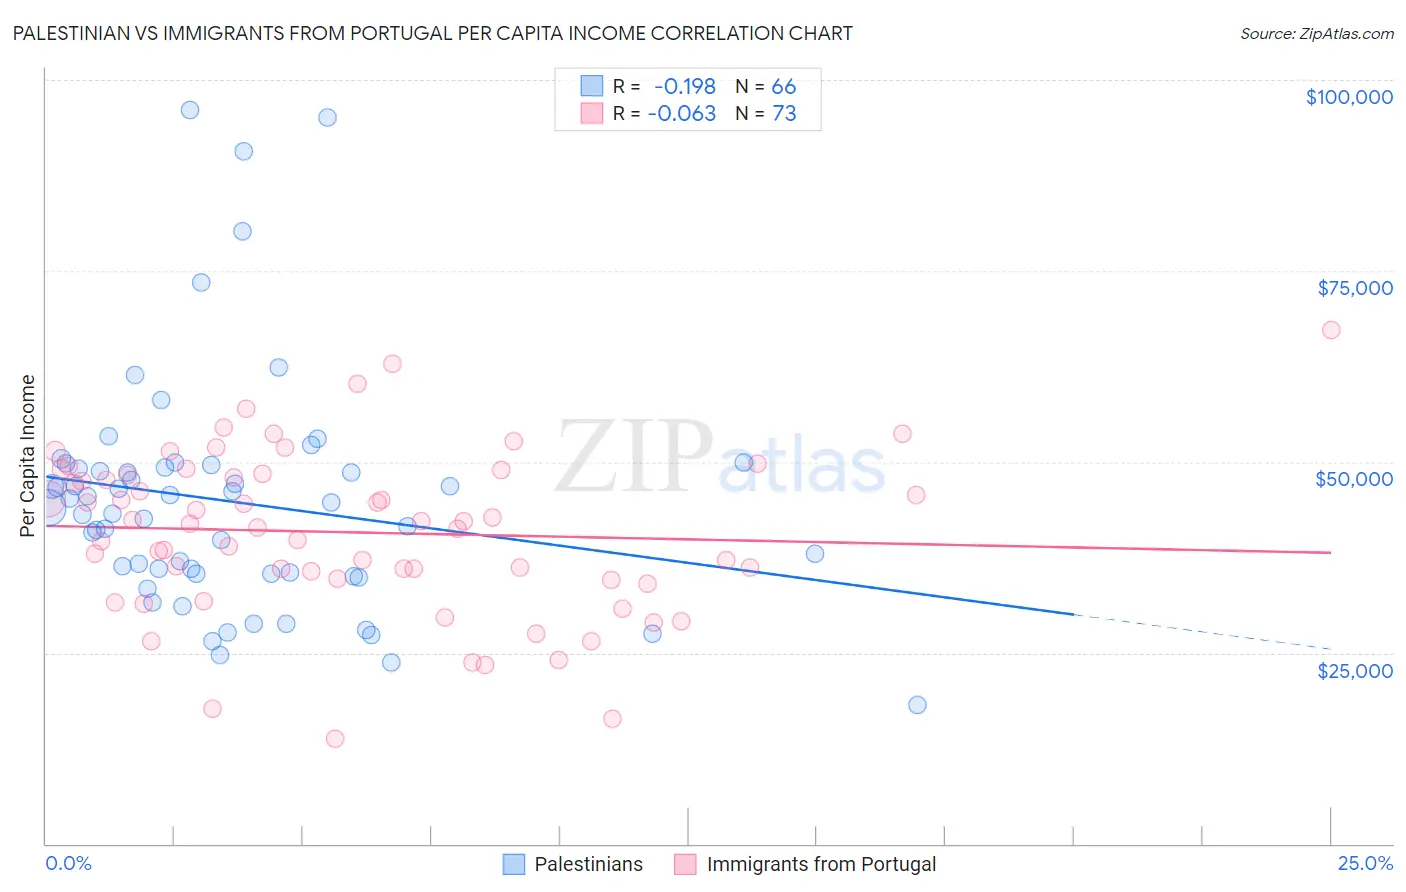
Palestinian vs Immigrants from Portugal Per Capita Income Correlation Chart
The statistical analysis conducted on geographies consisting of 216,465,639 people shows a poor negative correlation between the proportion of Palestinians and per capita income in the United States with a correlation coefficient (R) of -0.198 and weighted average of $45,790. Similarly, the statistical analysis conducted on geographies consisting of 174,792,548 people shows a slight negative correlation between the proportion of Immigrants from Portugal and per capita income in the United States with a correlation coefficient (R) of -0.063 and weighted average of $42,412, a difference of 8.0%.
Per Capita Income Correlation Summary
| Measurement | Palestinian | Immigrants from Portugal |
| Minimum | $18,117 | $13,756 |
| Maximum | $96,141 | $67,338 |
| Range | $78,024 | $53,582 |
| Mean | $44,786 | $40,766 |
| Median | $44,344 | $41,948 |
| Interquartile 25% (IQ1) | $35,413 | $34,644 |
| Interquartile 75% (IQ3) | $49,208 | $48,401 |
| Interquartile Range (IQR) | $13,795 | $13,757 |
| Standard Deviation (Sample) | $15,475 | $10,670 |
| Standard Deviation (Population) | $15,357 | $10,597 |
Similar Demographics by Per Capita Income
Demographics Similar to Palestinians by Per Capita Income
In terms of per capita income, the demographic groups most similar to Palestinians are Zimbabwean ($45,804, a difference of 0.030%), Immigrants from Germany ($45,751, a difference of 0.090%), Swedish ($45,750, a difference of 0.090%), European ($45,836, a difference of 0.10%), and Lebanese ($45,840, a difference of 0.11%).
| Demographics | Rating | Rank | Per Capita Income |
| Immigrants | Poland | 93.1 /100 | #119 | Exceptional $45,979 |
| Immigrants | Ethiopia | 92.7 /100 | #120 | Exceptional $45,923 |
| Canadians | 92.2 /100 | #121 | Exceptional $45,858 |
| Moroccans | 92.1 /100 | #122 | Exceptional $45,854 |
| Lebanese | 92.0 /100 | #123 | Exceptional $45,840 |
| Europeans | 92.0 /100 | #124 | Exceptional $45,836 |
| Zimbabweans | 91.7 /100 | #125 | Exceptional $45,804 |
| Palestinians | 91.6 /100 | #126 | Exceptional $45,790 |
| Immigrants | Germany | 91.3 /100 | #127 | Exceptional $45,751 |
| Swedes | 91.3 /100 | #128 | Exceptional $45,750 |
| Luxembourgers | 90.4 /100 | #129 | Exceptional $45,663 |
| Arabs | 90.4 /100 | #130 | Exceptional $45,662 |
| Immigrants | North Macedonia | 90.0 /100 | #131 | Exceptional $45,622 |
| Jordanians | 89.9 /100 | #132 | Excellent $45,605 |
| Pakistanis | 89.7 /100 | #133 | Excellent $45,587 |
Demographics Similar to Immigrants from Portugal by Per Capita Income
In terms of per capita income, the demographic groups most similar to Immigrants from Portugal are Barbadian ($42,406, a difference of 0.010%), Vietnamese ($42,368, a difference of 0.10%), Immigrants from Thailand ($42,289, a difference of 0.29%), Immigrants from Bosnia and Herzegovina ($42,278, a difference of 0.32%), and Scotch-Irish ($42,563, a difference of 0.36%).
| Demographics | Rating | Rank | Per Capita Income |
| Yugoslavians | 27.4 /100 | #191 | Fair $42,792 |
| Iraqis | 26.7 /100 | #192 | Fair $42,760 |
| Immigrants | Sierra Leone | 26.5 /100 | #193 | Fair $42,752 |
| Immigrants | Fiji | 25.2 /100 | #194 | Fair $42,694 |
| Immigrants | Kenya | 24.5 /100 | #195 | Fair $42,661 |
| Dutch | 23.4 /100 | #196 | Fair $42,605 |
| Scotch-Irish | 22.6 /100 | #197 | Fair $42,563 |
| Immigrants | Portugal | 19.7 /100 | #198 | Poor $42,412 |
| Barbadians | 19.6 /100 | #199 | Poor $42,406 |
| Vietnamese | 19.0 /100 | #200 | Poor $42,368 |
| Immigrants | Thailand | 17.6 /100 | #201 | Poor $42,289 |
| Immigrants | Bosnia and Herzegovina | 17.5 /100 | #202 | Poor $42,278 |
| Spanish | 17.0 /100 | #203 | Poor $42,249 |
| Aleuts | 16.4 /100 | #204 | Poor $42,210 |
| Whites/Caucasians | 15.9 /100 | #205 | Poor $42,180 |