Creek vs Immigrants from Portugal Poverty
COMPARE
Creek
Immigrants from Portugal
Poverty
Poverty Comparison
Creek
Immigrants from Portugal
15.6%
POVERTY
0.0/ 100
METRIC RATING
306th/ 347
METRIC RANK
12.3%
POVERTY
50.5/ 100
METRIC RATING
172nd/ 347
METRIC RANK
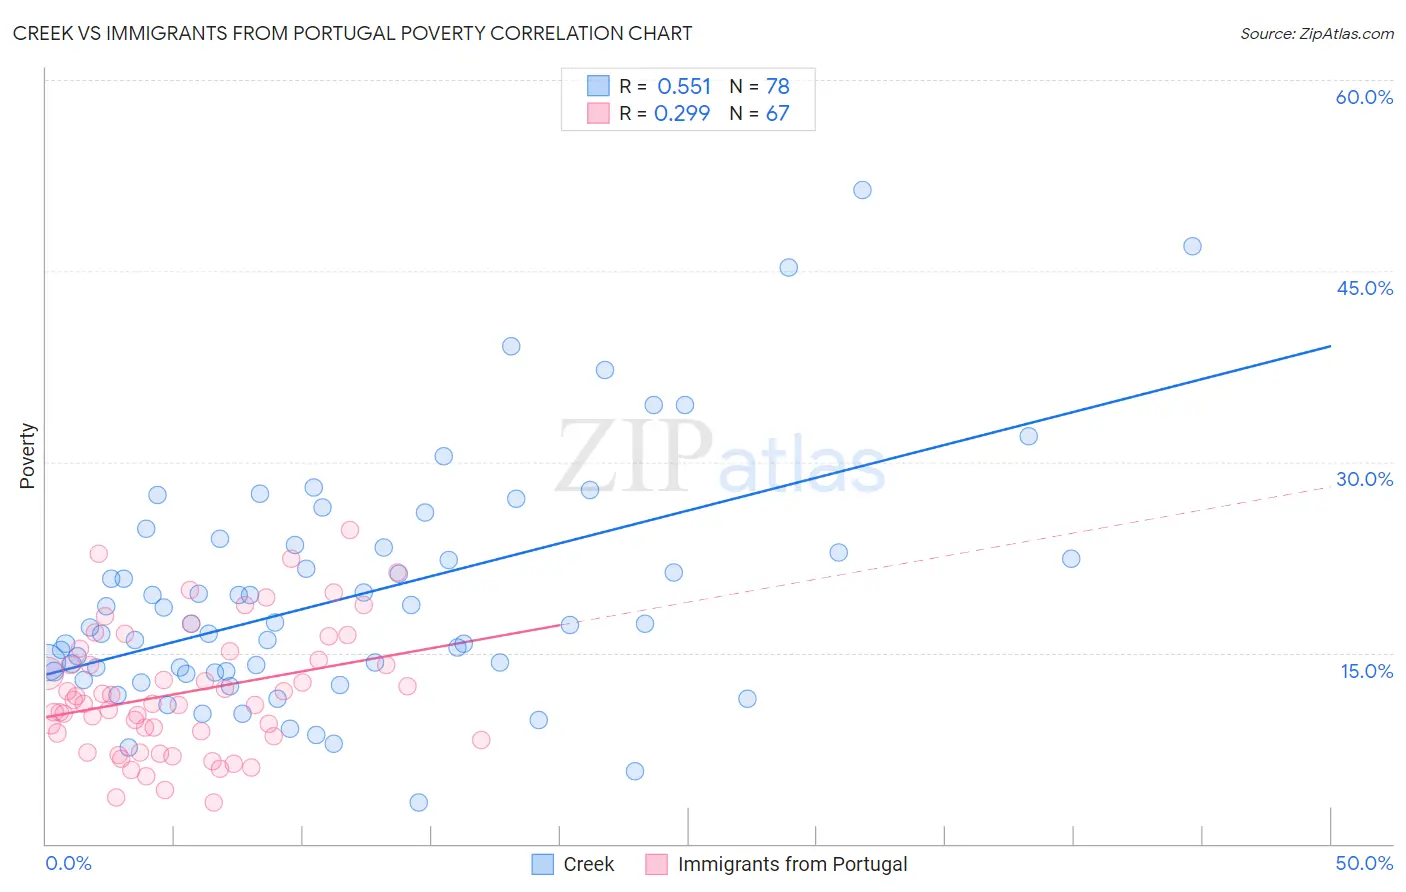
Creek vs Immigrants from Portugal Poverty Correlation Chart
The statistical analysis conducted on geographies consisting of 178,440,498 people shows a substantial positive correlation between the proportion of Creek and poverty level in the United States with a correlation coefficient (R) of 0.551 and weighted average of 15.6%. Similarly, the statistical analysis conducted on geographies consisting of 174,738,655 people shows a weak positive correlation between the proportion of Immigrants from Portugal and poverty level in the United States with a correlation coefficient (R) of 0.299 and weighted average of 12.3%, a difference of 26.5%.
Poverty Correlation Summary
| Measurement | Creek | Immigrants from Portugal |
| Minimum | 3.2% | 3.3% |
| Maximum | 51.4% | 24.6% |
| Range | 48.1% | 21.3% |
| Mean | 19.4% | 11.9% |
| Median | 17.2% | 11.0% |
| Interquartile 25% (IQ1) | 13.5% | 8.5% |
| Interquartile 75% (IQ3) | 23.3% | 15.1% |
| Interquartile Range (IQR) | 9.7% | 6.6% |
| Standard Deviation (Sample) | 9.2% | 4.9% |
| Standard Deviation (Population) | 9.2% | 4.9% |
Similar Demographics by Poverty
Demographics Similar to Creek by Poverty
In terms of poverty, the demographic groups most similar to Creek are African (15.6%, a difference of 0.070%), Choctaw (15.6%, a difference of 0.18%), Seminole (15.6%, a difference of 0.23%), Dutch West Indian (15.6%, a difference of 0.32%), and Immigrants from Guatemala (15.5%, a difference of 0.44%).
| Demographics | Rating | Rank | Poverty |
| Senegalese | 0.0 /100 | #299 | Tragic 15.3% |
| Immigrants | Central America | 0.0 /100 | #300 | Tragic 15.4% |
| Bahamians | 0.0 /100 | #301 | Tragic 15.4% |
| Somalis | 0.0 /100 | #302 | Tragic 15.4% |
| Immigrants | Caribbean | 0.0 /100 | #303 | Tragic 15.5% |
| Immigrants | Mexico | 0.0 /100 | #304 | Tragic 15.5% |
| Immigrants | Guatemala | 0.0 /100 | #305 | Tragic 15.5% |
| Creek | 0.0 /100 | #306 | Tragic 15.6% |
| Africans | 0.0 /100 | #307 | Tragic 15.6% |
| Choctaw | 0.0 /100 | #308 | Tragic 15.6% |
| Seminole | 0.0 /100 | #309 | Tragic 15.6% |
| Dutch West Indians | 0.0 /100 | #310 | Tragic 15.6% |
| Chippewa | 0.0 /100 | #311 | Tragic 15.7% |
| Cajuns | 0.0 /100 | #312 | Tragic 15.7% |
| Immigrants | Grenada | 0.0 /100 | #313 | Tragic 15.8% |
Demographics Similar to Immigrants from Portugal by Poverty
In terms of poverty, the demographic groups most similar to Immigrants from Portugal are Celtic (12.3%, a difference of 0.040%), Lebanese (12.3%, a difference of 0.050%), Immigrants from Spain (12.3%, a difference of 0.070%), South American (12.3%, a difference of 0.18%), and Immigrants from Colombia (12.3%, a difference of 0.28%).
| Demographics | Rating | Rank | Poverty |
| Immigrants | Albania | 57.7 /100 | #165 | Average 12.2% |
| Venezuelans | 56.9 /100 | #166 | Average 12.2% |
| Immigrants | Chile | 56.7 /100 | #167 | Average 12.2% |
| Immigrants | Venezuela | 56.5 /100 | #168 | Average 12.2% |
| Whites/Caucasians | 55.4 /100 | #169 | Average 12.3% |
| Immigrants | Oceania | 54.6 /100 | #170 | Average 12.3% |
| Immigrants | Spain | 51.3 /100 | #171 | Average 12.3% |
| Immigrants | Portugal | 50.5 /100 | #172 | Average 12.3% |
| Celtics | 50.1 /100 | #173 | Average 12.3% |
| Lebanese | 50.0 /100 | #174 | Average 12.3% |
| South Americans | 48.7 /100 | #175 | Average 12.3% |
| Immigrants | Colombia | 47.7 /100 | #176 | Average 12.3% |
| Immigrants | Syria | 47.5 /100 | #177 | Average 12.3% |
| Uruguayans | 44.7 /100 | #178 | Average 12.4% |
| Immigrants | Morocco | 44.0 /100 | #179 | Average 12.4% |