Pakistani vs Immigrants from Portugal Poverty
COMPARE
Pakistani
Immigrants from Portugal
Poverty
Poverty Comparison
Pakistanis
Immigrants from Portugal
11.9%
POVERTY
82.2/ 100
METRIC RATING
139th/ 347
METRIC RANK
12.3%
POVERTY
50.5/ 100
METRIC RATING
172nd/ 347
METRIC RANK
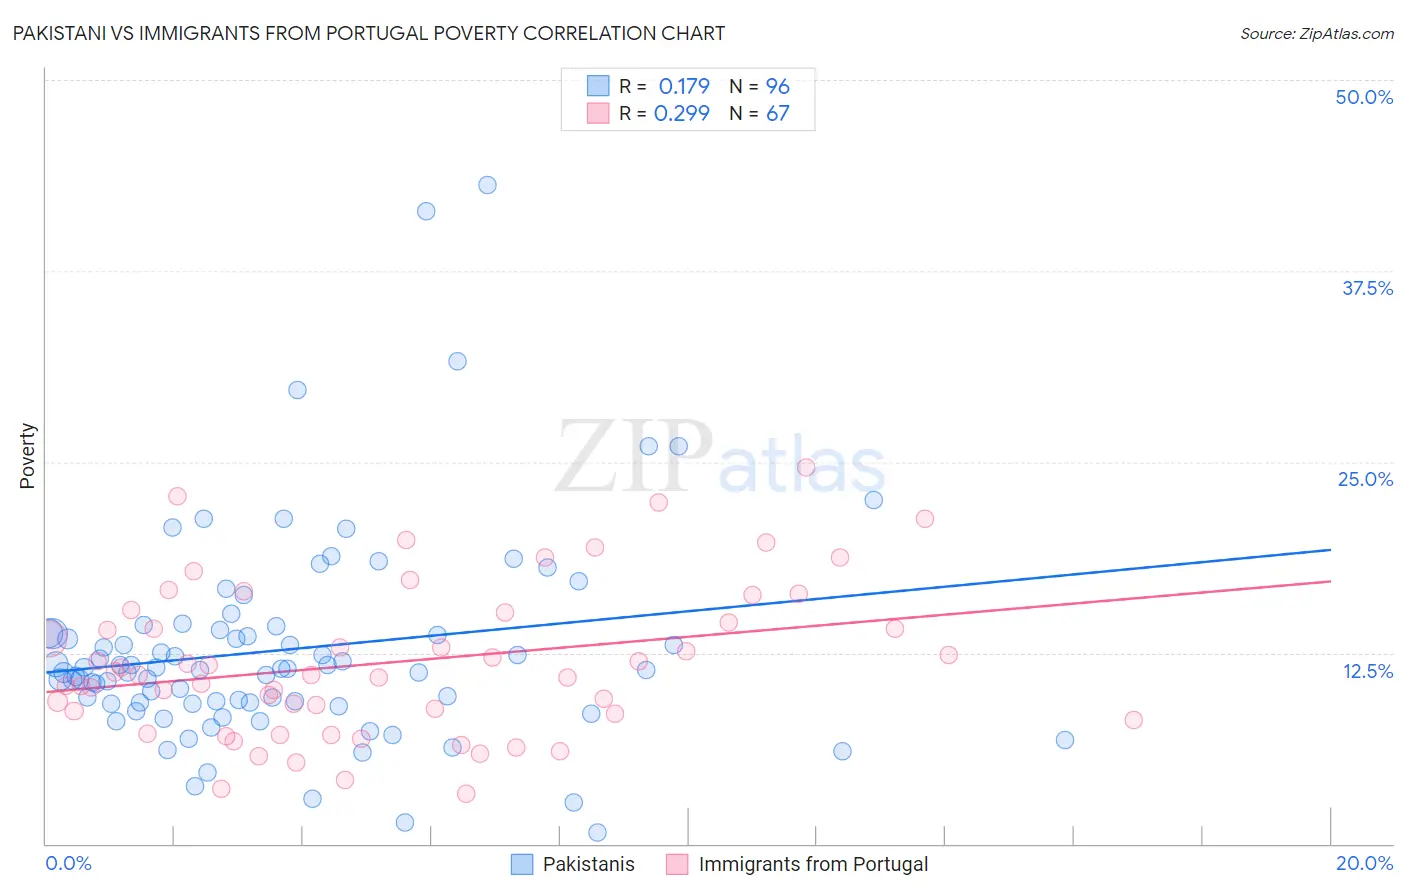
Pakistani vs Immigrants from Portugal Poverty Correlation Chart
The statistical analysis conducted on geographies consisting of 335,215,631 people shows a poor positive correlation between the proportion of Pakistanis and poverty level in the United States with a correlation coefficient (R) of 0.179 and weighted average of 11.9%. Similarly, the statistical analysis conducted on geographies consisting of 174,738,655 people shows a weak positive correlation between the proportion of Immigrants from Portugal and poverty level in the United States with a correlation coefficient (R) of 0.299 and weighted average of 12.3%, a difference of 3.8%.
Poverty Correlation Summary
| Measurement | Pakistani | Immigrants from Portugal |
| Minimum | 0.75% | 3.3% |
| Maximum | 43.1% | 24.6% |
| Range | 42.4% | 21.3% |
| Mean | 12.7% | 11.9% |
| Median | 11.4% | 11.0% |
| Interquartile 25% (IQ1) | 9.2% | 8.5% |
| Interquartile 75% (IQ3) | 13.9% | 15.1% |
| Interquartile Range (IQR) | 4.7% | 6.6% |
| Standard Deviation (Sample) | 7.0% | 4.9% |
| Standard Deviation (Population) | 6.9% | 4.9% |
Similar Demographics by Poverty
Demographics Similar to Pakistanis by Poverty
In terms of poverty, the demographic groups most similar to Pakistanis are Immigrants from Jordan (11.9%, a difference of 0.030%), Immigrants from Switzerland (11.8%, a difference of 0.14%), Immigrants from Peru (11.9%, a difference of 0.19%), Immigrants from France (11.9%, a difference of 0.28%), and Basque (11.9%, a difference of 0.30%).
| Demographics | Rating | Rank | Poverty |
| Peruvians | 85.6 /100 | #132 | Excellent 11.8% |
| Immigrants | Western Europe | 85.2 /100 | #133 | Excellent 11.8% |
| Yugoslavians | 85.2 /100 | #134 | Excellent 11.8% |
| Immigrants | Vietnam | 85.2 /100 | #135 | Excellent 11.8% |
| Chileans | 84.2 /100 | #136 | Excellent 11.8% |
| Immigrants | Switzerland | 83.0 /100 | #137 | Excellent 11.8% |
| Immigrants | Jordan | 82.4 /100 | #138 | Excellent 11.9% |
| Pakistanis | 82.2 /100 | #139 | Excellent 11.9% |
| Immigrants | Peru | 81.1 /100 | #140 | Excellent 11.9% |
| Immigrants | France | 80.5 /100 | #141 | Excellent 11.9% |
| Basques | 80.4 /100 | #142 | Excellent 11.9% |
| Brazilians | 79.7 /100 | #143 | Good 11.9% |
| Icelanders | 77.9 /100 | #144 | Good 11.9% |
| Syrians | 75.1 /100 | #145 | Good 12.0% |
| Afghans | 74.9 /100 | #146 | Good 12.0% |
Demographics Similar to Immigrants from Portugal by Poverty
In terms of poverty, the demographic groups most similar to Immigrants from Portugal are Celtic (12.3%, a difference of 0.040%), Lebanese (12.3%, a difference of 0.050%), Immigrants from Spain (12.3%, a difference of 0.070%), South American (12.3%, a difference of 0.18%), and Immigrants from Colombia (12.3%, a difference of 0.28%).
| Demographics | Rating | Rank | Poverty |
| Immigrants | Albania | 57.7 /100 | #165 | Average 12.2% |
| Venezuelans | 56.9 /100 | #166 | Average 12.2% |
| Immigrants | Chile | 56.7 /100 | #167 | Average 12.2% |
| Immigrants | Venezuela | 56.5 /100 | #168 | Average 12.2% |
| Whites/Caucasians | 55.4 /100 | #169 | Average 12.3% |
| Immigrants | Oceania | 54.6 /100 | #170 | Average 12.3% |
| Immigrants | Spain | 51.3 /100 | #171 | Average 12.3% |
| Immigrants | Portugal | 50.5 /100 | #172 | Average 12.3% |
| Celtics | 50.1 /100 | #173 | Average 12.3% |
| Lebanese | 50.0 /100 | #174 | Average 12.3% |
| South Americans | 48.7 /100 | #175 | Average 12.3% |
| Immigrants | Colombia | 47.7 /100 | #176 | Average 12.3% |
| Immigrants | Syria | 47.5 /100 | #177 | Average 12.3% |
| Uruguayans | 44.7 /100 | #178 | Average 12.4% |
| Immigrants | Morocco | 44.0 /100 | #179 | Average 12.4% |