Nigerian vs Soviet Union Single Female Poverty
COMPARE
Nigerian
Soviet Union
Single Female Poverty
Single Female Poverty Comparison
Nigerians
Soviet Union
21.4%
SINGLE FEMALE POVERTY
20.9/ 100
METRIC RATING
201st/ 347
METRIC RANK
19.6%
SINGLE FEMALE POVERTY
98.8/ 100
METRIC RATING
91st/ 347
METRIC RANK
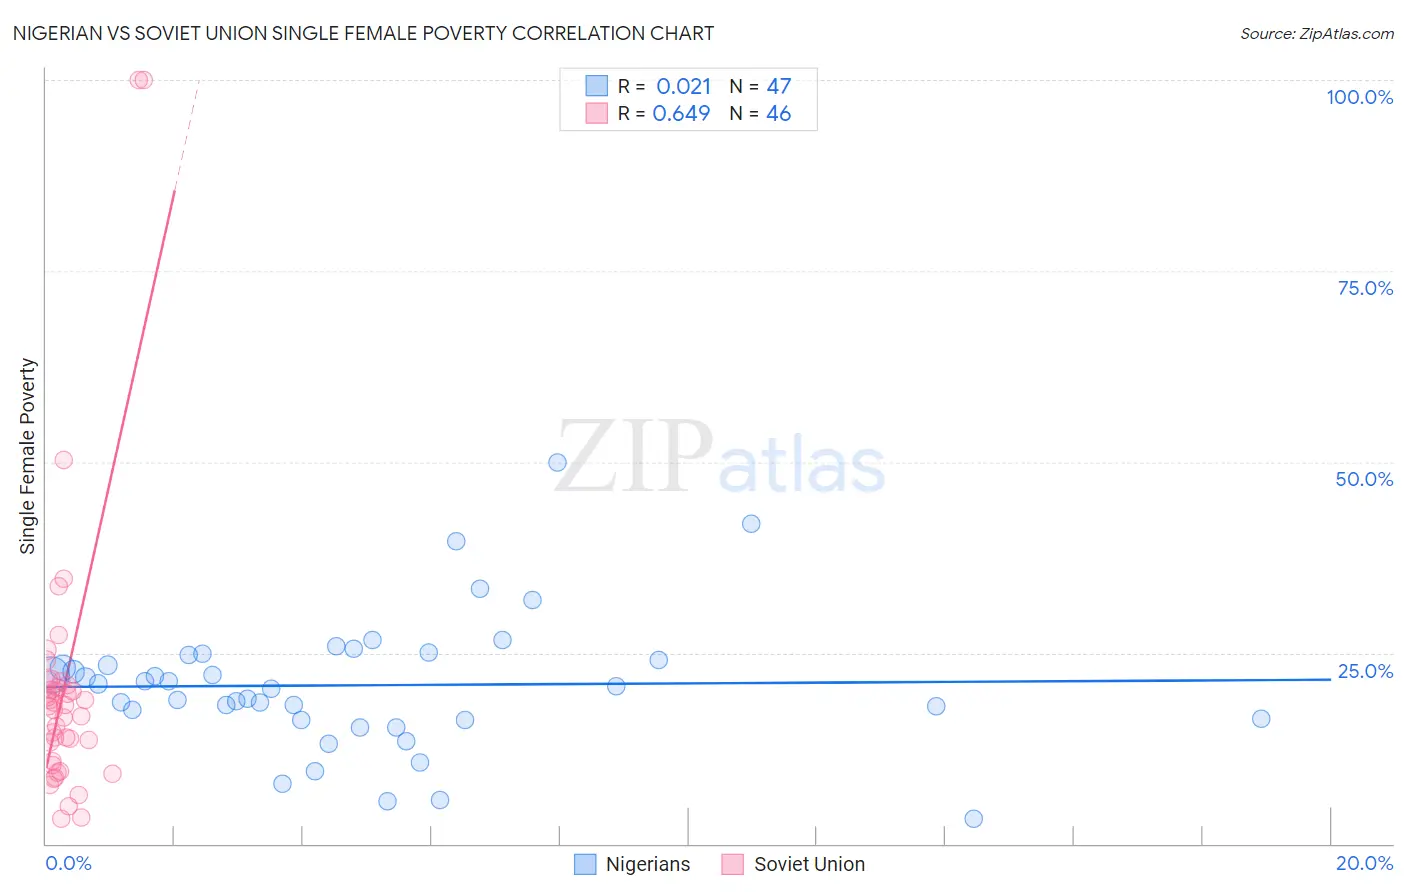
Nigerian vs Soviet Union Single Female Poverty Correlation Chart
The statistical analysis conducted on geographies consisting of 330,209,143 people shows no correlation between the proportion of Nigerians and poverty level among single females in the United States with a correlation coefficient (R) of 0.021 and weighted average of 21.4%. Similarly, the statistical analysis conducted on geographies consisting of 43,439,502 people shows a significant positive correlation between the proportion of Soviet Union and poverty level among single females in the United States with a correlation coefficient (R) of 0.649 and weighted average of 19.6%, a difference of 9.6%.
Single Female Poverty Correlation Summary
| Measurement | Nigerian | Soviet Union |
| Minimum | 3.3% | 3.3% |
| Maximum | 50.0% | 100.0% |
| Range | 46.7% | 96.7% |
| Mean | 20.7% | 20.7% |
| Median | 20.5% | 18.1% |
| Interquartile 25% (IQ1) | 16.2% | 10.8% |
| Interquartile 75% (IQ3) | 24.8% | 20.9% |
| Interquartile Range (IQR) | 8.6% | 10.0% |
| Standard Deviation (Sample) | 8.8% | 19.1% |
| Standard Deviation (Population) | 8.7% | 18.9% |
Similar Demographics by Single Female Poverty
Demographics Similar to Nigerians by Single Female Poverty
In terms of single female poverty, the demographic groups most similar to Nigerians are Immigrants from Kenya (21.4%, a difference of 0.020%), Irish (21.4%, a difference of 0.040%), Immigrants (21.4%, a difference of 0.10%), Immigrants from Haiti (21.5%, a difference of 0.20%), and Swiss (21.4%, a difference of 0.29%).
| Demographics | Rating | Rank | Single Female Poverty |
| Czechoslovakians | 27.7 /100 | #194 | Fair 21.3% |
| Nicaraguans | 27.6 /100 | #195 | Fair 21.3% |
| Immigrants | Saudi Arabia | 27.1 /100 | #196 | Fair 21.3% |
| Japanese | 26.4 /100 | #197 | Fair 21.3% |
| Swiss | 24.2 /100 | #198 | Fair 21.4% |
| Immigrants | Immigrants | 22.0 /100 | #199 | Fair 21.4% |
| Irish | 21.4 /100 | #200 | Fair 21.4% |
| Nigerians | 20.9 /100 | #201 | Fair 21.4% |
| Immigrants | Kenya | 20.7 /100 | #202 | Fair 21.4% |
| Immigrants | Haiti | 18.8 /100 | #203 | Poor 21.5% |
| Immigrants | Africa | 16.7 /100 | #204 | Poor 21.5% |
| Finns | 16.2 /100 | #205 | Poor 21.5% |
| Belgians | 16.1 /100 | #206 | Poor 21.5% |
| Ghanaians | 15.7 /100 | #207 | Poor 21.6% |
| Haitians | 15.4 /100 | #208 | Poor 21.6% |
Demographics Similar to Soviet Union by Single Female Poverty
In terms of single female poverty, the demographic groups most similar to Soviet Union are Italian (19.6%, a difference of 0.050%), Immigrants from Lebanon (19.6%, a difference of 0.060%), Immigrants from Austria (19.6%, a difference of 0.060%), Immigrants from Ukraine (19.5%, a difference of 0.24%), and Afghan (19.5%, a difference of 0.25%).
| Demographics | Rating | Rank | Single Female Poverty |
| Immigrants | Sweden | 99.2 /100 | #84 | Exceptional 19.4% |
| Immigrants | Albania | 99.2 /100 | #85 | Exceptional 19.4% |
| Greeks | 99.2 /100 | #86 | Exceptional 19.4% |
| Zimbabweans | 99.0 /100 | #87 | Exceptional 19.5% |
| Afghans | 99.0 /100 | #88 | Exceptional 19.5% |
| Immigrants | Ukraine | 99.0 /100 | #89 | Exceptional 19.5% |
| Immigrants | Lebanon | 98.8 /100 | #90 | Exceptional 19.6% |
| Soviet Union | 98.8 /100 | #91 | Exceptional 19.6% |
| Italians | 98.8 /100 | #92 | Exceptional 19.6% |
| Immigrants | Austria | 98.8 /100 | #93 | Exceptional 19.6% |
| Romanians | 98.6 /100 | #94 | Exceptional 19.6% |
| Estonians | 98.2 /100 | #95 | Exceptional 19.7% |
| Immigrants | Brazil | 98.2 /100 | #96 | Exceptional 19.7% |
| Croatians | 98.1 /100 | #97 | Exceptional 19.7% |
| Immigrants | France | 97.9 /100 | #98 | Exceptional 19.7% |