Latvian vs Soviet Union Single Female Poverty
COMPARE
Latvian
Soviet Union
Single Female Poverty
Single Female Poverty Comparison
Latvians
Soviet Union
19.0%
SINGLE FEMALE POVERTY
99.8/ 100
METRIC RATING
47th/ 347
METRIC RANK
19.6%
SINGLE FEMALE POVERTY
98.8/ 100
METRIC RATING
91st/ 347
METRIC RANK
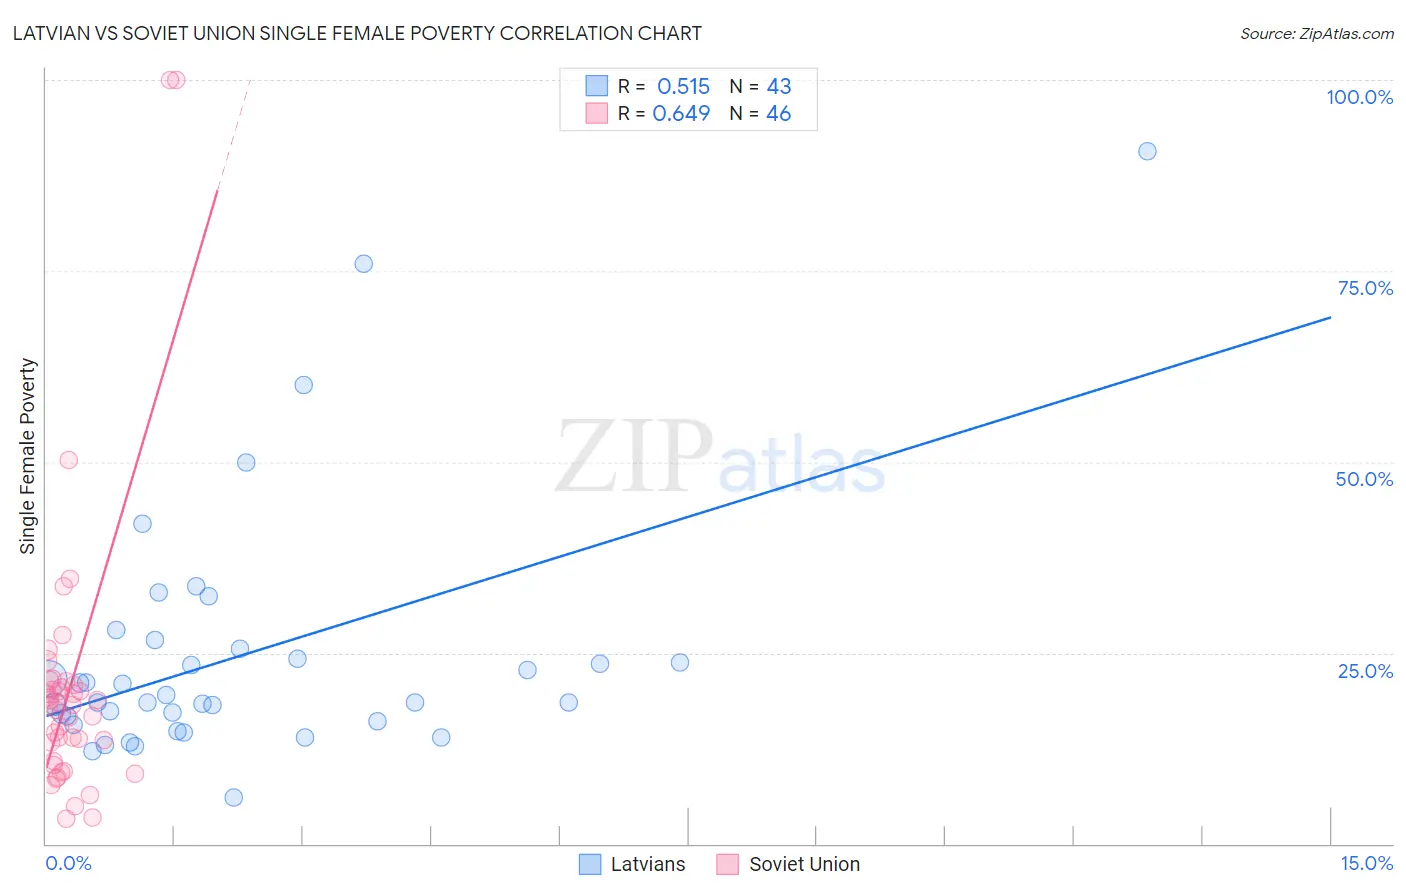
Latvian vs Soviet Union Single Female Poverty Correlation Chart
The statistical analysis conducted on geographies consisting of 217,777,893 people shows a substantial positive correlation between the proportion of Latvians and poverty level among single females in the United States with a correlation coefficient (R) of 0.515 and weighted average of 19.0%. Similarly, the statistical analysis conducted on geographies consisting of 43,439,502 people shows a significant positive correlation between the proportion of Soviet Union and poverty level among single females in the United States with a correlation coefficient (R) of 0.649 and weighted average of 19.6%, a difference of 3.1%.
Single Female Poverty Correlation Summary
| Measurement | Latvian | Soviet Union |
| Minimum | 6.0% | 3.3% |
| Maximum | 90.7% | 100.0% |
| Range | 84.7% | 96.7% |
| Mean | 24.7% | 20.7% |
| Median | 18.5% | 18.1% |
| Interquartile 25% (IQ1) | 16.0% | 10.8% |
| Interquartile 75% (IQ3) | 25.6% | 20.9% |
| Interquartile Range (IQR) | 9.5% | 10.0% |
| Standard Deviation (Sample) | 16.6% | 19.1% |
| Standard Deviation (Population) | 16.4% | 18.9% |
Similar Demographics by Single Female Poverty
Demographics Similar to Latvians by Single Female Poverty
In terms of single female poverty, the demographic groups most similar to Latvians are Macedonian (18.9%, a difference of 0.19%), Immigrants from Argentina (19.0%, a difference of 0.28%), Immigrants from Czechoslovakia (19.0%, a difference of 0.29%), Immigrants from Eastern Europe (19.0%, a difference of 0.33%), and Immigrants from Indonesia (18.9%, a difference of 0.35%).
| Demographics | Rating | Rank | Single Female Poverty |
| Okinawans | 99.9 /100 | #40 | Exceptional 18.8% |
| Immigrants | Serbia | 99.9 /100 | #41 | Exceptional 18.8% |
| Jordanians | 99.9 /100 | #42 | Exceptional 18.8% |
| Immigrants | Romania | 99.9 /100 | #43 | Exceptional 18.8% |
| Immigrants | Croatia | 99.9 /100 | #44 | Exceptional 18.9% |
| Immigrants | Indonesia | 99.8 /100 | #45 | Exceptional 18.9% |
| Macedonians | 99.8 /100 | #46 | Exceptional 18.9% |
| Latvians | 99.8 /100 | #47 | Exceptional 19.0% |
| Immigrants | Argentina | 99.8 /100 | #48 | Exceptional 19.0% |
| Immigrants | Czechoslovakia | 99.8 /100 | #49 | Exceptional 19.0% |
| Immigrants | Eastern Europe | 99.8 /100 | #50 | Exceptional 19.0% |
| Immigrants | Italy | 99.8 /100 | #51 | Exceptional 19.0% |
| Egyptians | 99.7 /100 | #52 | Exceptional 19.1% |
| Tsimshian | 99.7 /100 | #53 | Exceptional 19.1% |
| Argentineans | 99.7 /100 | #54 | Exceptional 19.1% |
Demographics Similar to Soviet Union by Single Female Poverty
In terms of single female poverty, the demographic groups most similar to Soviet Union are Italian (19.6%, a difference of 0.050%), Immigrants from Lebanon (19.6%, a difference of 0.060%), Immigrants from Austria (19.6%, a difference of 0.060%), Immigrants from Ukraine (19.5%, a difference of 0.24%), and Afghan (19.5%, a difference of 0.25%).
| Demographics | Rating | Rank | Single Female Poverty |
| Immigrants | Sweden | 99.2 /100 | #84 | Exceptional 19.4% |
| Immigrants | Albania | 99.2 /100 | #85 | Exceptional 19.4% |
| Greeks | 99.2 /100 | #86 | Exceptional 19.4% |
| Zimbabweans | 99.0 /100 | #87 | Exceptional 19.5% |
| Afghans | 99.0 /100 | #88 | Exceptional 19.5% |
| Immigrants | Ukraine | 99.0 /100 | #89 | Exceptional 19.5% |
| Immigrants | Lebanon | 98.8 /100 | #90 | Exceptional 19.6% |
| Soviet Union | 98.8 /100 | #91 | Exceptional 19.6% |
| Italians | 98.8 /100 | #92 | Exceptional 19.6% |
| Immigrants | Austria | 98.8 /100 | #93 | Exceptional 19.6% |
| Romanians | 98.6 /100 | #94 | Exceptional 19.6% |
| Estonians | 98.2 /100 | #95 | Exceptional 19.7% |
| Immigrants | Brazil | 98.2 /100 | #96 | Exceptional 19.7% |
| Croatians | 98.1 /100 | #97 | Exceptional 19.7% |
| Immigrants | France | 97.9 /100 | #98 | Exceptional 19.7% |