Hmong vs Soviet Union Single Female Poverty
COMPARE
Hmong
Soviet Union
Single Female Poverty
Single Female Poverty Comparison
Hmong
Soviet Union
23.1%
SINGLE FEMALE POVERTY
0.2/ 100
METRIC RATING
269th/ 347
METRIC RANK
19.6%
SINGLE FEMALE POVERTY
98.8/ 100
METRIC RATING
91st/ 347
METRIC RANK
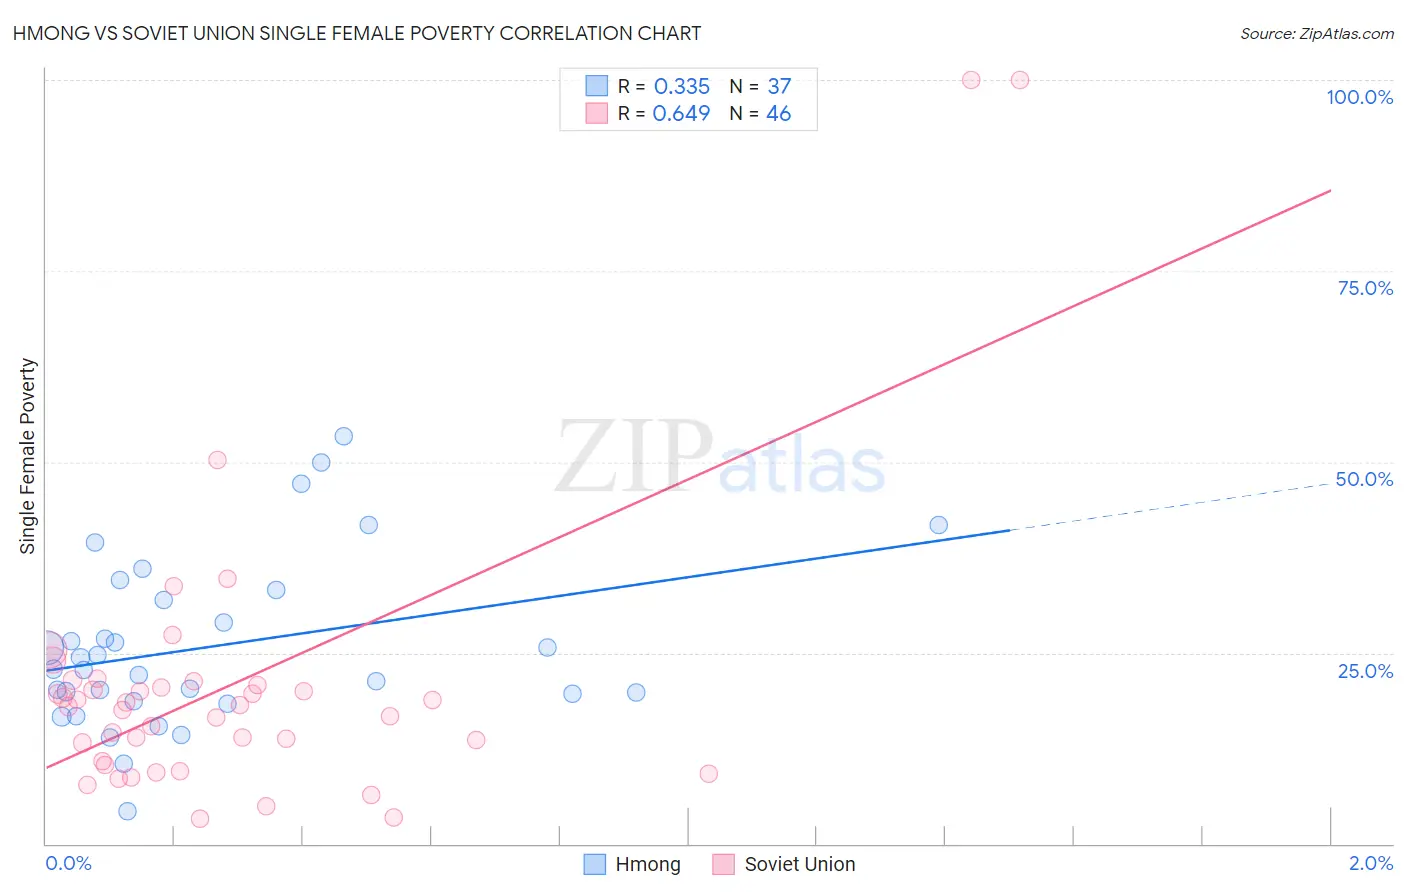
Hmong vs Soviet Union Single Female Poverty Correlation Chart
The statistical analysis conducted on geographies consisting of 24,642,418 people shows a mild positive correlation between the proportion of Hmong and poverty level among single females in the United States with a correlation coefficient (R) of 0.335 and weighted average of 23.1%. Similarly, the statistical analysis conducted on geographies consisting of 43,439,502 people shows a significant positive correlation between the proportion of Soviet Union and poverty level among single females in the United States with a correlation coefficient (R) of 0.649 and weighted average of 19.6%, a difference of 17.9%.
Single Female Poverty Correlation Summary
| Measurement | Hmong | Soviet Union |
| Minimum | 4.3% | 3.3% |
| Maximum | 53.4% | 100.0% |
| Range | 49.1% | 96.7% |
| Mean | 25.8% | 20.7% |
| Median | 22.9% | 18.1% |
| Interquartile 25% (IQ1) | 19.1% | 10.8% |
| Interquartile 75% (IQ3) | 32.5% | 20.9% |
| Interquartile Range (IQR) | 13.4% | 10.0% |
| Standard Deviation (Sample) | 11.0% | 19.1% |
| Standard Deviation (Population) | 10.9% | 18.9% |
Similar Demographics by Single Female Poverty
Demographics Similar to Hmong by Single Female Poverty
In terms of single female poverty, the demographic groups most similar to Hmong are Fijian (23.1%, a difference of 0.030%), Senegalese (23.0%, a difference of 0.10%), Immigrants from Micronesia (23.0%, a difference of 0.16%), Inupiat (23.1%, a difference of 0.26%), and Central American (23.0%, a difference of 0.37%).
| Demographics | Rating | Rank | Single Female Poverty |
| British West Indians | 0.4 /100 | #262 | Tragic 22.8% |
| Scotch-Irish | 0.3 /100 | #263 | Tragic 22.9% |
| Immigrants | Laos | 0.3 /100 | #264 | Tragic 22.9% |
| Central Americans | 0.2 /100 | #265 | Tragic 23.0% |
| Immigrants | Micronesia | 0.2 /100 | #266 | Tragic 23.0% |
| Senegalese | 0.2 /100 | #267 | Tragic 23.0% |
| Fijians | 0.2 /100 | #268 | Tragic 23.1% |
| Hmong | 0.2 /100 | #269 | Tragic 23.1% |
| Inupiat | 0.2 /100 | #270 | Tragic 23.1% |
| Sub-Saharan Africans | 0.1 /100 | #271 | Tragic 23.2% |
| Immigrants | Senegal | 0.1 /100 | #272 | Tragic 23.2% |
| Alaska Natives | 0.1 /100 | #273 | Tragic 23.3% |
| Marshallese | 0.1 /100 | #274 | Tragic 23.3% |
| Mexican American Indians | 0.1 /100 | #275 | Tragic 23.4% |
| Immigrants | Azores | 0.0 /100 | #276 | Tragic 23.5% |
Demographics Similar to Soviet Union by Single Female Poverty
In terms of single female poverty, the demographic groups most similar to Soviet Union are Italian (19.6%, a difference of 0.050%), Immigrants from Lebanon (19.6%, a difference of 0.060%), Immigrants from Austria (19.6%, a difference of 0.060%), Immigrants from Ukraine (19.5%, a difference of 0.24%), and Afghan (19.5%, a difference of 0.25%).
| Demographics | Rating | Rank | Single Female Poverty |
| Immigrants | Sweden | 99.2 /100 | #84 | Exceptional 19.4% |
| Immigrants | Albania | 99.2 /100 | #85 | Exceptional 19.4% |
| Greeks | 99.2 /100 | #86 | Exceptional 19.4% |
| Zimbabweans | 99.0 /100 | #87 | Exceptional 19.5% |
| Afghans | 99.0 /100 | #88 | Exceptional 19.5% |
| Immigrants | Ukraine | 99.0 /100 | #89 | Exceptional 19.5% |
| Immigrants | Lebanon | 98.8 /100 | #90 | Exceptional 19.6% |
| Soviet Union | 98.8 /100 | #91 | Exceptional 19.6% |
| Italians | 98.8 /100 | #92 | Exceptional 19.6% |
| Immigrants | Austria | 98.8 /100 | #93 | Exceptional 19.6% |
| Romanians | 98.6 /100 | #94 | Exceptional 19.6% |
| Estonians | 98.2 /100 | #95 | Exceptional 19.7% |
| Immigrants | Brazil | 98.2 /100 | #96 | Exceptional 19.7% |
| Croatians | 98.1 /100 | #97 | Exceptional 19.7% |
| Immigrants | France | 97.9 /100 | #98 | Exceptional 19.7% |