Ugandan vs Soviet Union Single Female Poverty
COMPARE
Ugandan
Soviet Union
Single Female Poverty
Single Female Poverty Comparison
Ugandans
Soviet Union
20.8%
SINGLE FEMALE POVERTY
64.0/ 100
METRIC RATING
165th/ 347
METRIC RANK
19.6%
SINGLE FEMALE POVERTY
98.8/ 100
METRIC RATING
91st/ 347
METRIC RANK
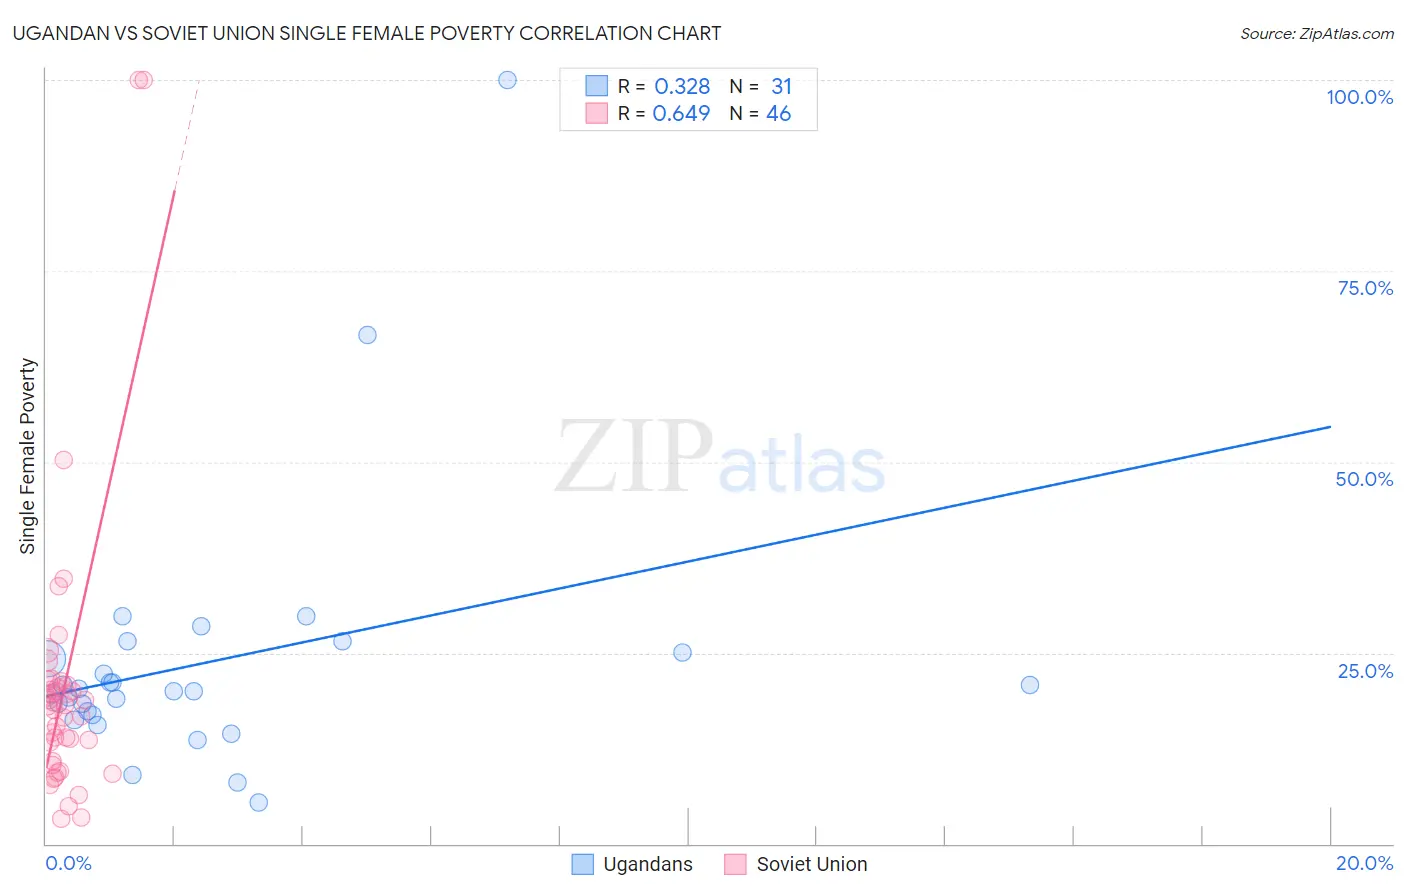
Ugandan vs Soviet Union Single Female Poverty Correlation Chart
The statistical analysis conducted on geographies consisting of 93,803,349 people shows a mild positive correlation between the proportion of Ugandans and poverty level among single females in the United States with a correlation coefficient (R) of 0.328 and weighted average of 20.8%. Similarly, the statistical analysis conducted on geographies consisting of 43,439,502 people shows a significant positive correlation between the proportion of Soviet Union and poverty level among single females in the United States with a correlation coefficient (R) of 0.649 and weighted average of 19.6%, a difference of 6.4%.
Single Female Poverty Correlation Summary
| Measurement | Ugandan | Soviet Union |
| Minimum | 5.5% | 3.3% |
| Maximum | 100.0% | 100.0% |
| Range | 94.5% | 96.7% |
| Mean | 23.7% | 20.7% |
| Median | 20.0% | 18.1% |
| Interquartile 25% (IQ1) | 16.9% | 10.8% |
| Interquartile 75% (IQ3) | 25.0% | 20.9% |
| Interquartile Range (IQR) | 8.1% | 10.0% |
| Standard Deviation (Sample) | 17.5% | 19.1% |
| Standard Deviation (Population) | 17.2% | 18.9% |
Similar Demographics by Single Female Poverty
Demographics Similar to Ugandans by Single Female Poverty
In terms of single female poverty, the demographic groups most similar to Ugandans are Iraqi (20.8%, a difference of 0.040%), Norwegian (20.8%, a difference of 0.060%), Immigrants from Norway (20.8%, a difference of 0.070%), Immigrants from Costa Rica (20.9%, a difference of 0.16%), and Lebanese (20.8%, a difference of 0.26%).
| Demographics | Rating | Rank | Single Female Poverty |
| Danes | 73.0 /100 | #158 | Good 20.7% |
| Costa Ricans | 71.8 /100 | #159 | Good 20.7% |
| Arabs | 70.8 /100 | #160 | Good 20.7% |
| Kenyans | 68.5 /100 | #161 | Good 20.8% |
| Northern Europeans | 68.4 /100 | #162 | Good 20.8% |
| Lebanese | 67.6 /100 | #163 | Good 20.8% |
| Iraqis | 64.5 /100 | #164 | Good 20.8% |
| Ugandans | 64.0 /100 | #165 | Good 20.8% |
| Norwegians | 63.0 /100 | #166 | Good 20.8% |
| Immigrants | Norway | 63.0 /100 | #167 | Good 20.8% |
| Immigrants | Costa Rica | 61.5 /100 | #168 | Good 20.9% |
| Immigrants | Trinidad and Tobago | 56.3 /100 | #169 | Average 20.9% |
| New Zealanders | 53.2 /100 | #170 | Average 21.0% |
| Moroccans | 52.8 /100 | #171 | Average 21.0% |
| Guyanese | 52.0 /100 | #172 | Average 21.0% |
Demographics Similar to Soviet Union by Single Female Poverty
In terms of single female poverty, the demographic groups most similar to Soviet Union are Italian (19.6%, a difference of 0.050%), Immigrants from Lebanon (19.6%, a difference of 0.060%), Immigrants from Austria (19.6%, a difference of 0.060%), Immigrants from Ukraine (19.5%, a difference of 0.24%), and Afghan (19.5%, a difference of 0.25%).
| Demographics | Rating | Rank | Single Female Poverty |
| Immigrants | Sweden | 99.2 /100 | #84 | Exceptional 19.4% |
| Immigrants | Albania | 99.2 /100 | #85 | Exceptional 19.4% |
| Greeks | 99.2 /100 | #86 | Exceptional 19.4% |
| Zimbabweans | 99.0 /100 | #87 | Exceptional 19.5% |
| Afghans | 99.0 /100 | #88 | Exceptional 19.5% |
| Immigrants | Ukraine | 99.0 /100 | #89 | Exceptional 19.5% |
| Immigrants | Lebanon | 98.8 /100 | #90 | Exceptional 19.6% |
| Soviet Union | 98.8 /100 | #91 | Exceptional 19.6% |
| Italians | 98.8 /100 | #92 | Exceptional 19.6% |
| Immigrants | Austria | 98.8 /100 | #93 | Exceptional 19.6% |
| Romanians | 98.6 /100 | #94 | Exceptional 19.6% |
| Estonians | 98.2 /100 | #95 | Exceptional 19.7% |
| Immigrants | Brazil | 98.2 /100 | #96 | Exceptional 19.7% |
| Croatians | 98.1 /100 | #97 | Exceptional 19.7% |
| Immigrants | France | 97.9 /100 | #98 | Exceptional 19.7% |