Osage vs Soviet Union Divorced or Separated
COMPARE
Osage
Soviet Union
Divorced or Separated
Divorced or Separated Comparison
Osage
Soviet Union
13.4%
DIVORCED OR SEPARATED
0.0/ 100
METRIC RATING
324th/ 347
METRIC RANK
11.1%
DIVORCED OR SEPARATED
100.0/ 100
METRIC RATING
40th/ 347
METRIC RANK
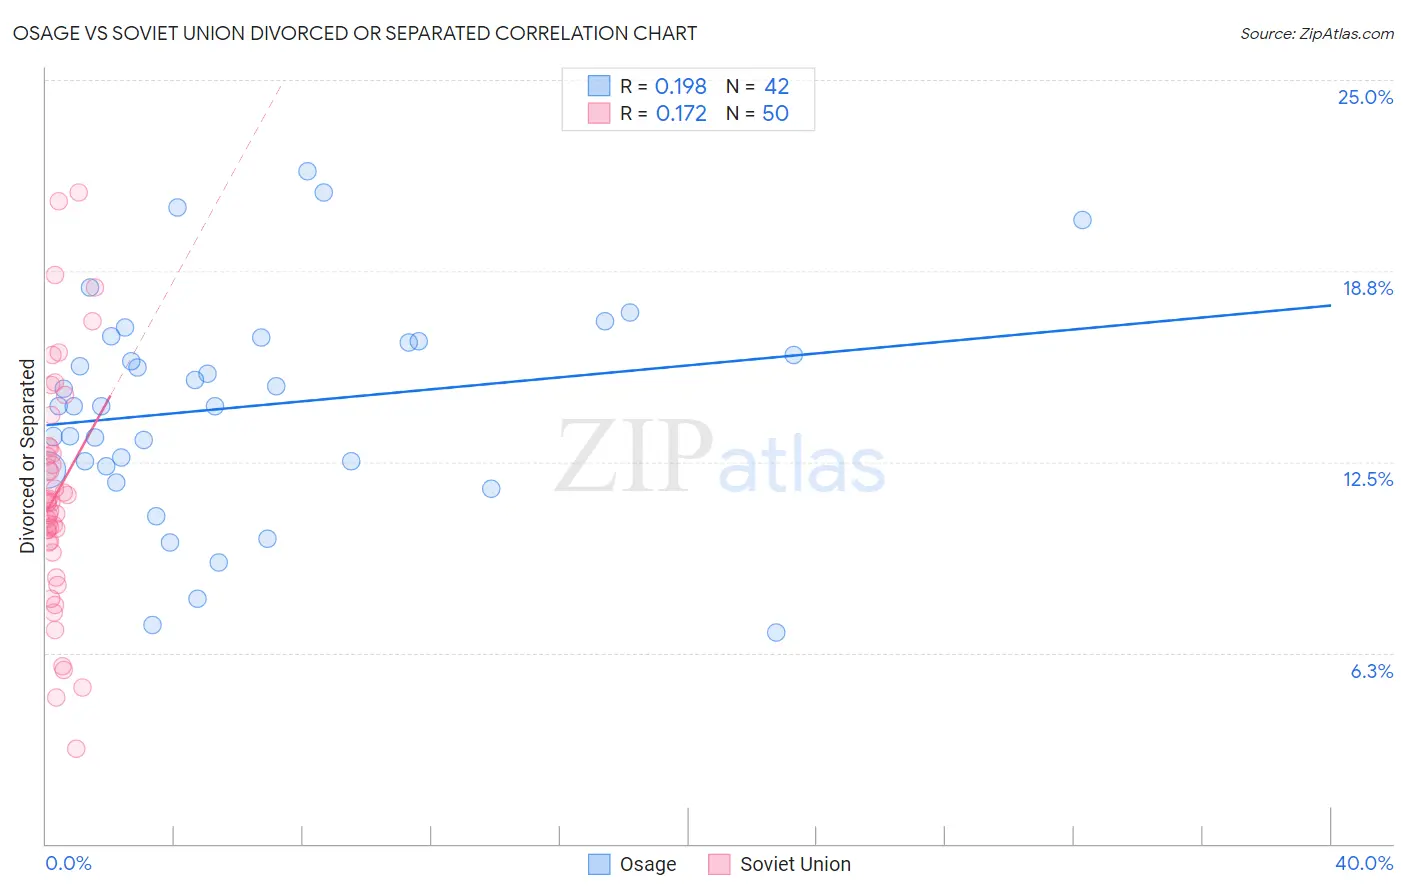
Osage vs Soviet Union Divorced or Separated Correlation Chart
The statistical analysis conducted on geographies consisting of 91,805,923 people shows a poor positive correlation between the proportion of Osage and percentage of population currently divorced or separated in the United States with a correlation coefficient (R) of 0.198 and weighted average of 13.4%. Similarly, the statistical analysis conducted on geographies consisting of 43,509,630 people shows a poor positive correlation between the proportion of Soviet Union and percentage of population currently divorced or separated in the United States with a correlation coefficient (R) of 0.172 and weighted average of 11.1%, a difference of 20.6%.
Divorced or Separated Correlation Summary
| Measurement | Osage | Soviet Union |
| Minimum | 6.9% | 3.1% |
| Maximum | 22.0% | 21.3% |
| Range | 15.1% | 18.2% |
| Mean | 14.3% | 11.4% |
| Median | 14.3% | 11.2% |
| Interquartile 25% (IQ1) | 12.3% | 9.9% |
| Interquartile 75% (IQ3) | 16.5% | 13.0% |
| Interquartile Range (IQR) | 4.1% | 3.1% |
| Standard Deviation (Sample) | 3.5% | 3.9% |
| Standard Deviation (Population) | 3.5% | 3.8% |
Similar Demographics by Divorced or Separated
Demographics Similar to Osage by Divorced or Separated
In terms of divorced or separated, the demographic groups most similar to Osage are Potawatomi (13.5%, a difference of 0.060%), U.S. Virgin Islander (13.4%, a difference of 0.070%), Immigrants from Congo (13.5%, a difference of 0.070%), Immigrants from Haiti (13.4%, a difference of 0.29%), and Cheyenne (13.4%, a difference of 0.53%).
| Demographics | Rating | Rank | Divorced or Separated |
| Haitians | 0.0 /100 | #317 | Tragic 13.3% |
| Cree | 0.0 /100 | #318 | Tragic 13.4% |
| Puget Sound Salish | 0.0 /100 | #319 | Tragic 13.4% |
| Cajuns | 0.0 /100 | #320 | Tragic 13.4% |
| Cheyenne | 0.0 /100 | #321 | Tragic 13.4% |
| Immigrants | Haiti | 0.0 /100 | #322 | Tragic 13.4% |
| U.S. Virgin Islanders | 0.0 /100 | #323 | Tragic 13.4% |
| Osage | 0.0 /100 | #324 | Tragic 13.4% |
| Potawatomi | 0.0 /100 | #325 | Tragic 13.5% |
| Immigrants | Congo | 0.0 /100 | #326 | Tragic 13.5% |
| Comanche | 0.0 /100 | #327 | Tragic 13.5% |
| Immigrants | Caribbean | 0.0 /100 | #328 | Tragic 13.6% |
| Houma | 0.0 /100 | #329 | Tragic 13.6% |
| Paiute | 0.0 /100 | #330 | Tragic 13.6% |
| Blacks/African Americans | 0.0 /100 | #331 | Tragic 13.6% |
Demographics Similar to Soviet Union by Divorced or Separated
In terms of divorced or separated, the demographic groups most similar to Soviet Union are Immigrants from Egypt (11.1%, a difference of 0.090%), Bhutanese (11.2%, a difference of 0.28%), Immigrants from Greece (11.1%, a difference of 0.33%), Chinese (11.2%, a difference of 0.34%), and Immigrants from Belarus (11.2%, a difference of 0.35%).
| Demographics | Rating | Rank | Divorced or Separated |
| Egyptians | 100.0 /100 | #33 | Exceptional 11.1% |
| Immigrants | Uzbekistan | 100.0 /100 | #34 | Exceptional 11.1% |
| Cambodians | 100.0 /100 | #35 | Exceptional 11.1% |
| Immigrants | Japan | 100.0 /100 | #36 | Exceptional 11.1% |
| Immigrants | Lebanon | 100.0 /100 | #37 | Exceptional 11.1% |
| Immigrants | Greece | 100.0 /100 | #38 | Exceptional 11.1% |
| Immigrants | Egypt | 100.0 /100 | #39 | Exceptional 11.1% |
| Soviet Union | 100.0 /100 | #40 | Exceptional 11.1% |
| Bhutanese | 100.0 /100 | #41 | Exceptional 11.2% |
| Chinese | 100.0 /100 | #42 | Exceptional 11.2% |
| Immigrants | Belarus | 100.0 /100 | #43 | Exceptional 11.2% |
| Immigrants | Western Asia | 100.0 /100 | #44 | Exceptional 11.2% |
| Turks | 100.0 /100 | #45 | Exceptional 11.2% |
| Laotians | 100.0 /100 | #46 | Exceptional 11.2% |
| Immigrants | Poland | 100.0 /100 | #47 | Exceptional 11.2% |