Menominee vs Soviet Union Single Female Poverty
COMPARE
Menominee
Soviet Union
Single Female Poverty
Single Female Poverty Comparison
Menominee
Soviet Union
27.8%
SINGLE FEMALE POVERTY
0.0/ 100
METRIC RATING
329th/ 347
METRIC RANK
19.6%
SINGLE FEMALE POVERTY
98.8/ 100
METRIC RATING
91st/ 347
METRIC RANK
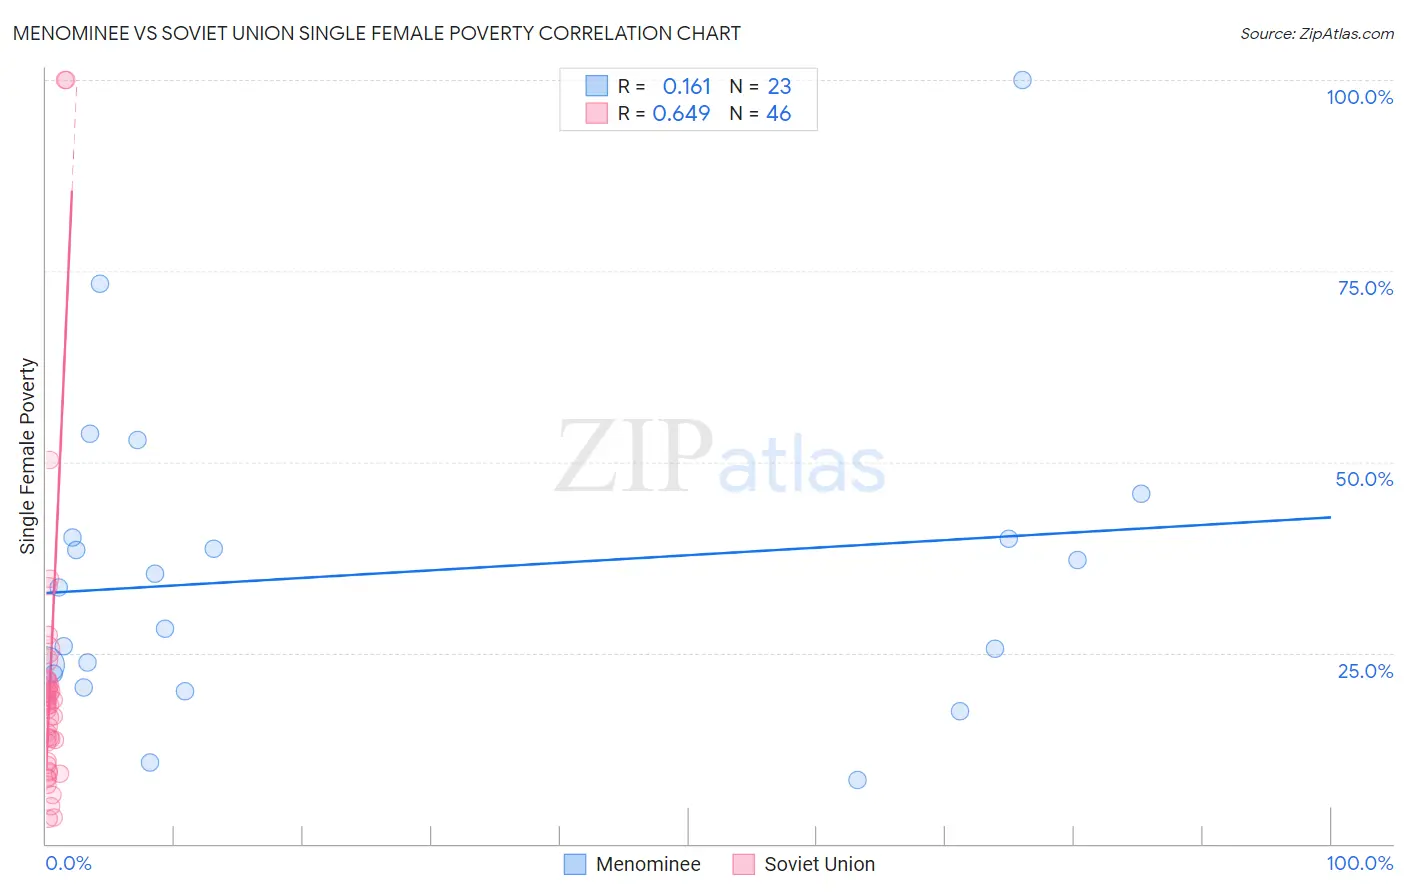
Menominee vs Soviet Union Single Female Poverty Correlation Chart
The statistical analysis conducted on geographies consisting of 45,620,212 people shows a poor positive correlation between the proportion of Menominee and poverty level among single females in the United States with a correlation coefficient (R) of 0.161 and weighted average of 27.8%. Similarly, the statistical analysis conducted on geographies consisting of 43,439,502 people shows a significant positive correlation between the proportion of Soviet Union and poverty level among single females in the United States with a correlation coefficient (R) of 0.649 and weighted average of 19.6%, a difference of 42.3%.
Single Female Poverty Correlation Summary
| Measurement | Menominee | Soviet Union |
| Minimum | 8.3% | 3.3% |
| Maximum | 100.0% | 100.0% |
| Range | 91.7% | 96.7% |
| Mean | 35.4% | 20.7% |
| Median | 33.5% | 18.1% |
| Interquartile 25% (IQ1) | 22.3% | 10.8% |
| Interquartile 75% (IQ3) | 40.1% | 20.9% |
| Interquartile Range (IQR) | 17.8% | 10.0% |
| Standard Deviation (Sample) | 20.5% | 19.1% |
| Standard Deviation (Population) | 20.1% | 18.9% |
Similar Demographics by Single Female Poverty
Demographics Similar to Menominee by Single Female Poverty
In terms of single female poverty, the demographic groups most similar to Menominee are Apache (27.7%, a difference of 0.46%), Hopi (28.0%, a difference of 0.71%), Native/Alaskan (28.2%, a difference of 1.3%), Dutch West Indian (27.5%, a difference of 1.4%), and Creek (27.4%, a difference of 1.5%).
| Demographics | Rating | Rank | Single Female Poverty |
| Seminole | 0.0 /100 | #322 | Tragic 26.8% |
| Chippewa | 0.0 /100 | #323 | Tragic 26.8% |
| Kiowa | 0.0 /100 | #324 | Tragic 26.9% |
| Choctaw | 0.0 /100 | #325 | Tragic 27.2% |
| Creek | 0.0 /100 | #326 | Tragic 27.4% |
| Dutch West Indians | 0.0 /100 | #327 | Tragic 27.5% |
| Apache | 0.0 /100 | #328 | Tragic 27.7% |
| Menominee | 0.0 /100 | #329 | Tragic 27.8% |
| Hopi | 0.0 /100 | #330 | Tragic 28.0% |
| Natives/Alaskans | 0.0 /100 | #331 | Tragic 28.2% |
| Yakama | 0.0 /100 | #332 | Tragic 28.3% |
| Ute | 0.0 /100 | #333 | Tragic 28.4% |
| Pueblo | 0.0 /100 | #334 | Tragic 28.6% |
| Immigrants | Yemen | 0.0 /100 | #335 | Tragic 28.9% |
| Colville | 0.0 /100 | #336 | Tragic 29.1% |
Demographics Similar to Soviet Union by Single Female Poverty
In terms of single female poverty, the demographic groups most similar to Soviet Union are Italian (19.6%, a difference of 0.050%), Immigrants from Lebanon (19.6%, a difference of 0.060%), Immigrants from Austria (19.6%, a difference of 0.060%), Immigrants from Ukraine (19.5%, a difference of 0.24%), and Afghan (19.5%, a difference of 0.25%).
| Demographics | Rating | Rank | Single Female Poverty |
| Immigrants | Sweden | 99.2 /100 | #84 | Exceptional 19.4% |
| Immigrants | Albania | 99.2 /100 | #85 | Exceptional 19.4% |
| Greeks | 99.2 /100 | #86 | Exceptional 19.4% |
| Zimbabweans | 99.0 /100 | #87 | Exceptional 19.5% |
| Afghans | 99.0 /100 | #88 | Exceptional 19.5% |
| Immigrants | Ukraine | 99.0 /100 | #89 | Exceptional 19.5% |
| Immigrants | Lebanon | 98.8 /100 | #90 | Exceptional 19.6% |
| Soviet Union | 98.8 /100 | #91 | Exceptional 19.6% |
| Italians | 98.8 /100 | #92 | Exceptional 19.6% |
| Immigrants | Austria | 98.8 /100 | #93 | Exceptional 19.6% |
| Romanians | 98.6 /100 | #94 | Exceptional 19.6% |
| Estonians | 98.2 /100 | #95 | Exceptional 19.7% |
| Immigrants | Brazil | 98.2 /100 | #96 | Exceptional 19.7% |
| Croatians | 98.1 /100 | #97 | Exceptional 19.7% |
| Immigrants | France | 97.9 /100 | #98 | Exceptional 19.7% |