Immigrants from South Central Asia vs Colombian Married-Couple Family Poverty
COMPARE
Immigrants from South Central Asia
Colombian
Married-Couple Family Poverty
Married-Couple Family Poverty Comparison
Immigrants from South Central Asia
Colombians
4.3%
MARRIED-COUPLE FAMILY POVERTY
99.8/ 100
METRIC RATING
47th/ 347
METRIC RANK
5.6%
MARRIED-COUPLE FAMILY POVERTY
9.2/ 100
METRIC RATING
220th/ 347
METRIC RANK
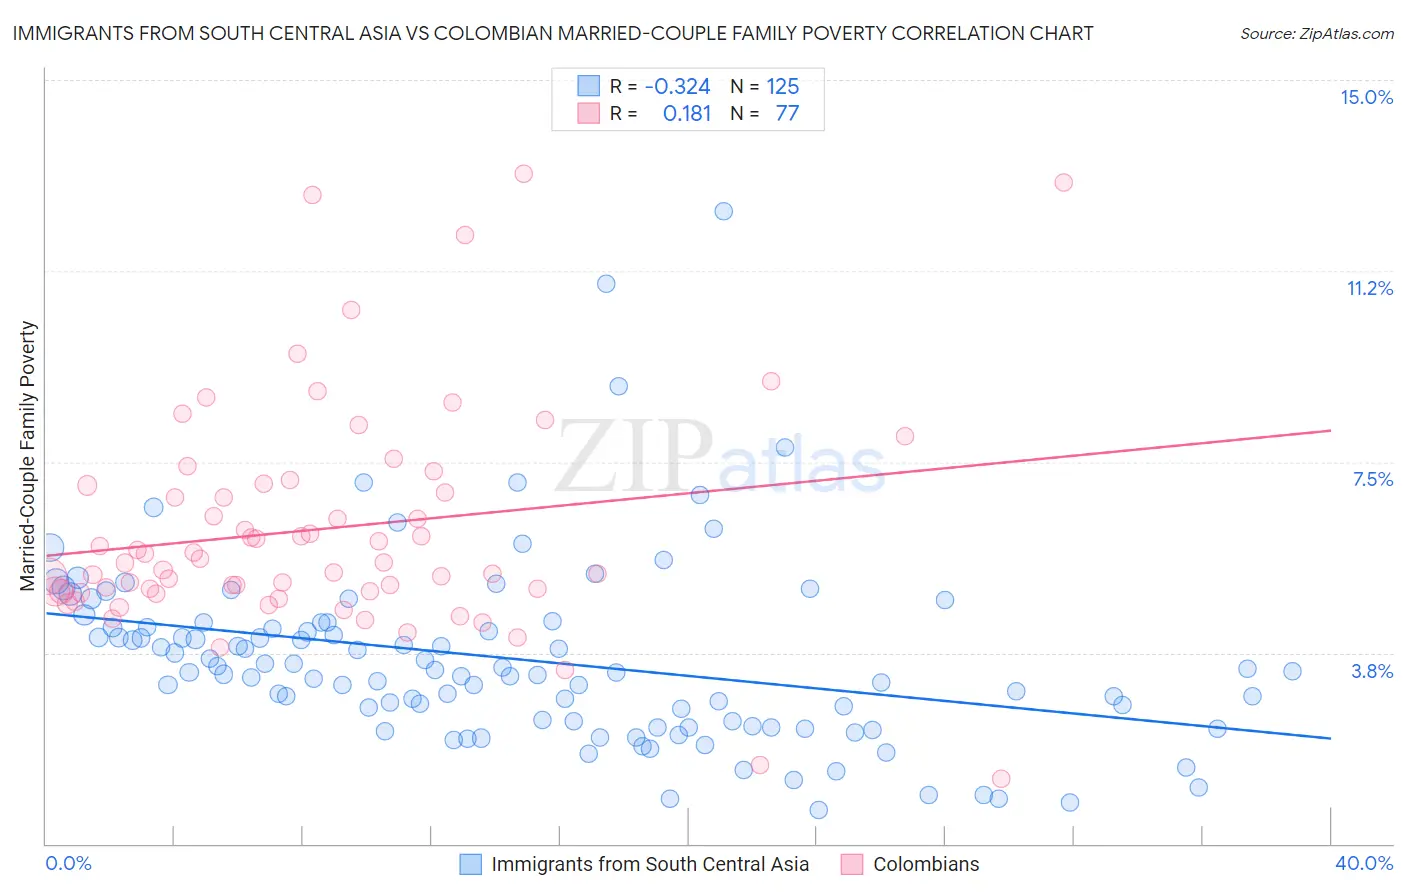
Immigrants from South Central Asia vs Colombian Married-Couple Family Poverty Correlation Chart
The statistical analysis conducted on geographies consisting of 466,887,426 people shows a mild negative correlation between the proportion of Immigrants from South Central Asia and poverty level among married-couple families in the United States with a correlation coefficient (R) of -0.324 and weighted average of 4.3%. Similarly, the statistical analysis conducted on geographies consisting of 415,629,712 people shows a poor positive correlation between the proportion of Colombians and poverty level among married-couple families in the United States with a correlation coefficient (R) of 0.181 and weighted average of 5.6%, a difference of 29.2%.
Married-Couple Family Poverty Correlation Summary
| Measurement | Immigrants from South Central Asia | Colombian |
| Minimum | 0.66% | 1.3% |
| Maximum | 12.4% | 13.2% |
| Range | 11.8% | 11.9% |
| Mean | 3.6% | 6.2% |
| Median | 3.4% | 5.5% |
| Interquartile 25% (IQ1) | 2.4% | 5.0% |
| Interquartile 75% (IQ3) | 4.3% | 7.1% |
| Interquartile Range (IQR) | 1.9% | 2.1% |
| Standard Deviation (Sample) | 1.8% | 2.2% |
| Standard Deviation (Population) | 1.8% | 2.2% |
Similar Demographics by Married-Couple Family Poverty
Demographics Similar to Immigrants from South Central Asia by Married-Couple Family Poverty
In terms of married-couple family poverty, the demographic groups most similar to Immigrants from South Central Asia are Australian (4.3%, a difference of 0.070%), British (4.3%, a difference of 0.12%), Serbian (4.3%, a difference of 0.14%), Turkish (4.3%, a difference of 0.15%), and Immigrants from Japan (4.3%, a difference of 0.16%).
| Demographics | Rating | Rank | Married-Couple Family Poverty |
| French Canadians | 99.8 /100 | #40 | Exceptional 4.2% |
| Northern Europeans | 99.8 /100 | #41 | Exceptional 4.3% |
| Scottish | 99.8 /100 | #42 | Exceptional 4.3% |
| Swiss | 99.8 /100 | #43 | Exceptional 4.3% |
| Immigrants | Japan | 99.8 /100 | #44 | Exceptional 4.3% |
| Serbians | 99.8 /100 | #45 | Exceptional 4.3% |
| British | 99.8 /100 | #46 | Exceptional 4.3% |
| Immigrants | South Central Asia | 99.8 /100 | #47 | Exceptional 4.3% |
| Australians | 99.7 /100 | #48 | Exceptional 4.3% |
| Turks | 99.7 /100 | #49 | Exceptional 4.3% |
| Burmese | 99.7 /100 | #50 | Exceptional 4.3% |
| Immigrants | Lithuania | 99.7 /100 | #51 | Exceptional 4.3% |
| Russians | 99.7 /100 | #52 | Exceptional 4.3% |
| Welsh | 99.7 /100 | #53 | Exceptional 4.3% |
| Austrians | 99.7 /100 | #54 | Exceptional 4.3% |
Demographics Similar to Colombians by Married-Couple Family Poverty
In terms of married-couple family poverty, the demographic groups most similar to Colombians are Panamanian (5.6%, a difference of 0.020%), Japanese (5.6%, a difference of 0.19%), Afghan (5.5%, a difference of 0.59%), Immigrants from Nigeria (5.5%, a difference of 0.61%), and Cajun (5.6%, a difference of 0.87%).
| Demographics | Rating | Rank | Married-Couple Family Poverty |
| Immigrants | Liberia | 13.3 /100 | #213 | Poor 5.5% |
| Iroquois | 13.1 /100 | #214 | Poor 5.5% |
| Armenians | 12.8 /100 | #215 | Poor 5.5% |
| Potawatomi | 12.4 /100 | #216 | Poor 5.5% |
| Immigrants | Nigeria | 11.3 /100 | #217 | Poor 5.5% |
| Afghans | 11.2 /100 | #218 | Poor 5.5% |
| Japanese | 9.8 /100 | #219 | Tragic 5.6% |
| Colombians | 9.2 /100 | #220 | Tragic 5.6% |
| Panamanians | 9.2 /100 | #221 | Tragic 5.6% |
| Cajuns | 6.9 /100 | #222 | Tragic 5.6% |
| Immigrants | Fiji | 6.7 /100 | #223 | Tragic 5.6% |
| Sudanese | 6.4 /100 | #224 | Tragic 5.6% |
| Immigrants | Cambodia | 6.1 /100 | #225 | Tragic 5.6% |
| South Americans | 5.7 /100 | #226 | Tragic 5.6% |
| Immigrants | Zaire | 5.6 /100 | #227 | Tragic 5.6% |