Luxembourger vs Menominee Single Male Poverty
COMPARE
Luxembourger
Menominee
Single Male Poverty
Single Male Poverty Comparison
Luxembourgers
Menominee
13.4%
SINGLE MALE POVERTY
3.6/ 100
METRIC RATING
236th/ 347
METRIC RANK
17.7%
SINGLE MALE POVERTY
0.0/ 100
METRIC RATING
327th/ 347
METRIC RANK
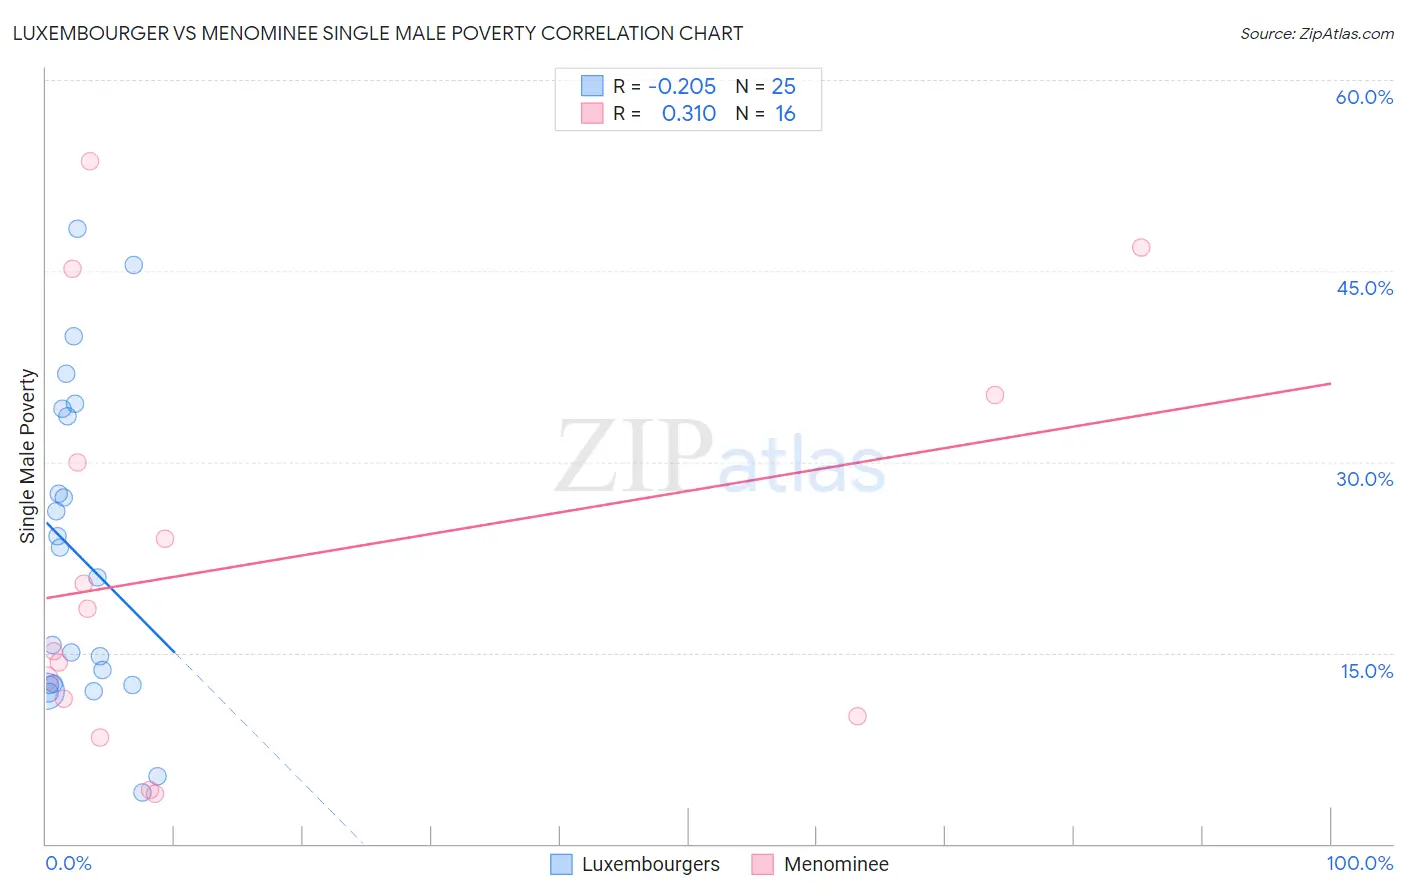
Luxembourger vs Menominee Single Male Poverty Correlation Chart
The statistical analysis conducted on geographies consisting of 133,228,824 people shows a weak negative correlation between the proportion of Luxembourgers and poverty level among single males in the United States with a correlation coefficient (R) of -0.205 and weighted average of 13.4%. Similarly, the statistical analysis conducted on geographies consisting of 44,140,338 people shows a mild positive correlation between the proportion of Menominee and poverty level among single males in the United States with a correlation coefficient (R) of 0.310 and weighted average of 17.7%, a difference of 32.7%.
Single Male Poverty Correlation Summary
| Measurement | Luxembourger | Menominee |
| Minimum | 4.0% | 3.9% |
| Maximum | 48.3% | 53.7% |
| Range | 44.3% | 49.8% |
| Mean | 22.6% | 22.1% |
| Median | 20.9% | 16.8% |
| Interquartile 25% (IQ1) | 12.5% | 10.7% |
| Interquartile 75% (IQ3) | 33.9% | 32.6% |
| Interquartile Range (IQR) | 21.4% | 22.0% |
| Standard Deviation (Sample) | 12.4% | 15.7% |
| Standard Deviation (Population) | 12.1% | 15.2% |
Similar Demographics by Single Male Poverty
Demographics Similar to Luxembourgers by Single Male Poverty
In terms of single male poverty, the demographic groups most similar to Luxembourgers are Bangladeshi (13.3%, a difference of 0.050%), British West Indian (13.4%, a difference of 0.060%), Canadian (13.3%, a difference of 0.15%), British (13.3%, a difference of 0.16%), and Immigrants from Ghana (13.4%, a difference of 0.16%).
| Demographics | Rating | Rank | Single Male Poverty |
| Europeans | 6.2 /100 | #229 | Tragic 13.3% |
| Ghanaians | 6.1 /100 | #230 | Tragic 13.3% |
| Slavs | 5.3 /100 | #231 | Tragic 13.3% |
| Immigrants | Caribbean | 5.0 /100 | #232 | Tragic 13.3% |
| British | 4.0 /100 | #233 | Tragic 13.3% |
| Canadians | 4.0 /100 | #234 | Tragic 13.3% |
| Bangladeshis | 3.7 /100 | #235 | Tragic 13.3% |
| Luxembourgers | 3.6 /100 | #236 | Tragic 13.4% |
| British West Indians | 3.4 /100 | #237 | Tragic 13.4% |
| Immigrants | Ghana | 3.2 /100 | #238 | Tragic 13.4% |
| Czechoslovakians | 3.0 /100 | #239 | Tragic 13.4% |
| Belizeans | 2.3 /100 | #240 | Tragic 13.4% |
| Immigrants | Germany | 2.1 /100 | #241 | Tragic 13.4% |
| Carpatho Rusyns | 2.1 /100 | #242 | Tragic 13.4% |
| Barbadians | 2.1 /100 | #243 | Tragic 13.4% |
Demographics Similar to Menominee by Single Male Poverty
In terms of single male poverty, the demographic groups most similar to Menominee are Central American Indian (17.2%, a difference of 2.7%), Kiowa (18.3%, a difference of 3.3%), Colville (18.4%, a difference of 4.0%), Choctaw (17.0%, a difference of 4.3%), and Immigrants from Yemen (16.9%, a difference of 5.1%).
| Demographics | Rating | Rank | Single Male Poverty |
| Marshallese | 0.0 /100 | #320 | Tragic 16.4% |
| Osage | 0.0 /100 | #321 | Tragic 16.5% |
| Shoshone | 0.0 /100 | #322 | Tragic 16.7% |
| Creek | 0.0 /100 | #323 | Tragic 16.8% |
| Immigrants | Yemen | 0.0 /100 | #324 | Tragic 16.9% |
| Choctaw | 0.0 /100 | #325 | Tragic 17.0% |
| Central American Indians | 0.0 /100 | #326 | Tragic 17.2% |
| Menominee | 0.0 /100 | #327 | Tragic 17.7% |
| Kiowa | 0.0 /100 | #328 | Tragic 18.3% |
| Colville | 0.0 /100 | #329 | Tragic 18.4% |
| Cajuns | 0.0 /100 | #330 | Tragic 19.1% |
| Paiute | 0.0 /100 | #331 | Tragic 19.3% |
| Natives/Alaskans | 0.0 /100 | #332 | Tragic 19.6% |
| Inupiat | 0.0 /100 | #333 | Tragic 20.0% |
| Pima | 0.0 /100 | #334 | Tragic 20.2% |