Luxembourger vs Immigrants from Western Europe Single Male Poverty
COMPARE
Luxembourger
Immigrants from Western Europe
Single Male Poverty
Single Male Poverty Comparison
Luxembourgers
Immigrants from Western Europe
13.4%
SINGLE MALE POVERTY
3.6/ 100
METRIC RATING
236th/ 347
METRIC RANK
13.2%
SINGLE MALE POVERTY
10.0/ 100
METRIC RATING
222nd/ 347
METRIC RANK
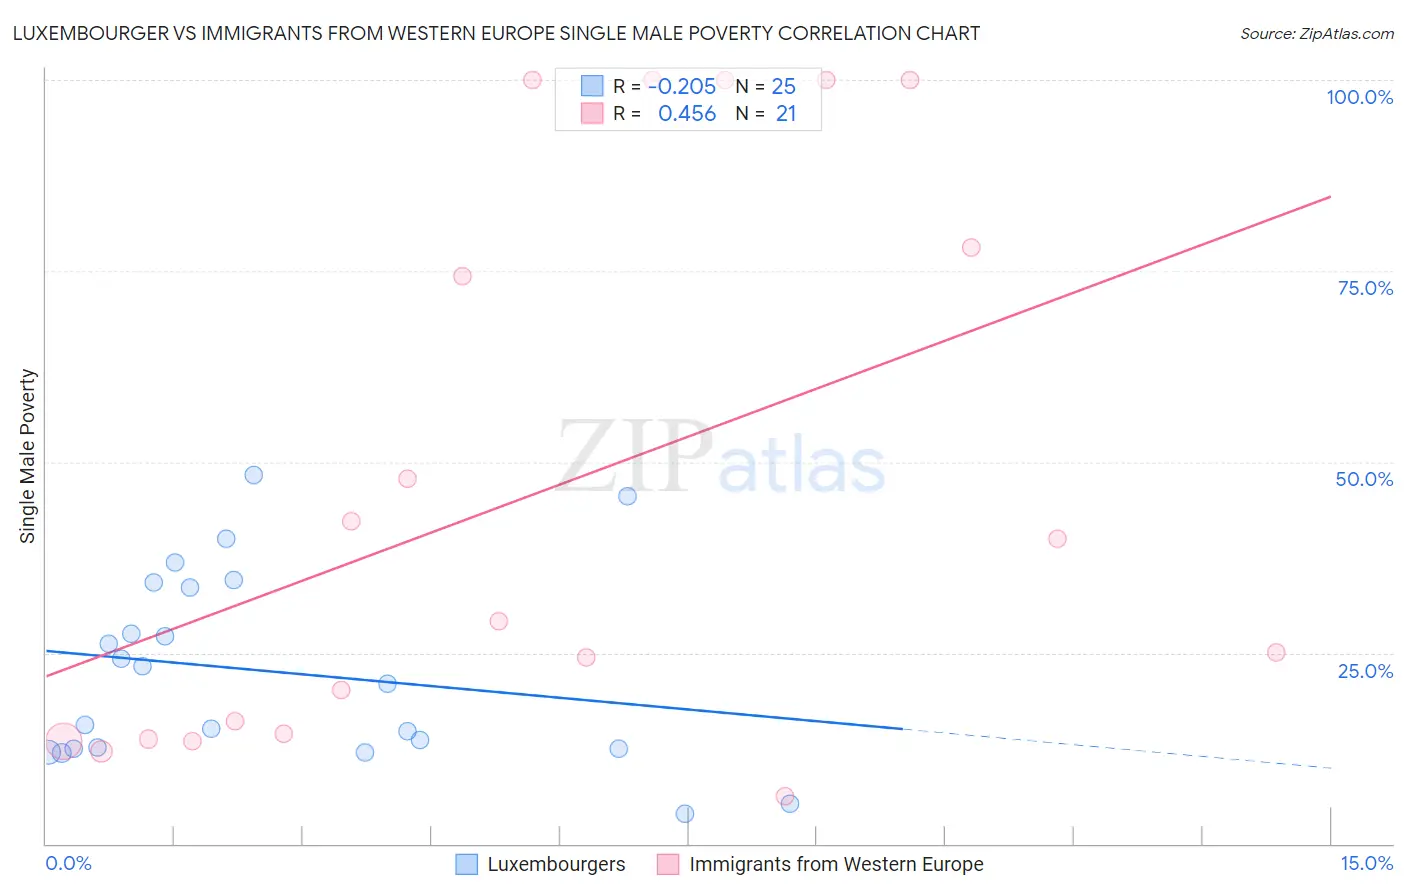
Luxembourger vs Immigrants from Western Europe Single Male Poverty Correlation Chart
The statistical analysis conducted on geographies consisting of 133,228,824 people shows a weak negative correlation between the proportion of Luxembourgers and poverty level among single males in the United States with a correlation coefficient (R) of -0.205 and weighted average of 13.4%. Similarly, the statistical analysis conducted on geographies consisting of 423,836,608 people shows a moderate positive correlation between the proportion of Immigrants from Western Europe and poverty level among single males in the United States with a correlation coefficient (R) of 0.456 and weighted average of 13.2%, a difference of 1.4%.
Single Male Poverty Correlation Summary
| Measurement | Luxembourger | Immigrants from Western Europe |
| Minimum | 4.0% | 6.2% |
| Maximum | 48.3% | 100.0% |
| Range | 44.3% | 93.8% |
| Mean | 22.6% | 46.2% |
| Median | 20.9% | 29.2% |
| Interquartile 25% (IQ1) | 12.5% | 14.1% |
| Interquartile 75% (IQ3) | 33.9% | 89.0% |
| Interquartile Range (IQR) | 21.4% | 74.9% |
| Standard Deviation (Sample) | 12.4% | 36.1% |
| Standard Deviation (Population) | 12.1% | 35.3% |
Demographics Similar to Luxembourgers and Immigrants from Western Europe by Single Male Poverty
In terms of single male poverty, the demographic groups most similar to Luxembourgers are Bangladeshi (13.3%, a difference of 0.050%), British West Indian (13.4%, a difference of 0.060%), Canadian (13.3%, a difference of 0.15%), British (13.3%, a difference of 0.16%), and Immigrants from Ghana (13.4%, a difference of 0.16%). Similarly, the demographic groups most similar to Immigrants from Western Europe are New Zealander (13.2%, a difference of 0.090%), Central American (13.2%, a difference of 0.11%), Immigrants from the Azores (13.2%, a difference of 0.11%), Somali (13.2%, a difference of 0.15%), and Immigrants from Denmark (13.2%, a difference of 0.20%).
| Demographics | Rating | Rank | Single Male Poverty |
| Immigrants | Burma/Myanmar | 12.6 /100 | #219 | Poor 13.1% |
| Central Americans | 10.9 /100 | #220 | Poor 13.2% |
| New Zealanders | 10.7 /100 | #221 | Poor 13.2% |
| Immigrants | Western Europe | 10.0 /100 | #222 | Poor 13.2% |
| Immigrants | Azores | 9.3 /100 | #223 | Tragic 13.2% |
| Somalis | 9.1 /100 | #224 | Tragic 13.2% |
| Immigrants | Denmark | 8.7 /100 | #225 | Tragic 13.2% |
| Jamaicans | 7.7 /100 | #226 | Tragic 13.2% |
| Haitians | 7.0 /100 | #227 | Tragic 13.2% |
| Lebanese | 6.6 /100 | #228 | Tragic 13.2% |
| Europeans | 6.2 /100 | #229 | Tragic 13.3% |
| Ghanaians | 6.1 /100 | #230 | Tragic 13.3% |
| Slavs | 5.3 /100 | #231 | Tragic 13.3% |
| Immigrants | Caribbean | 5.0 /100 | #232 | Tragic 13.3% |
| British | 4.0 /100 | #233 | Tragic 13.3% |
| Canadians | 4.0 /100 | #234 | Tragic 13.3% |
| Bangladeshis | 3.7 /100 | #235 | Tragic 13.3% |
| Luxembourgers | 3.6 /100 | #236 | Tragic 13.4% |
| British West Indians | 3.4 /100 | #237 | Tragic 13.4% |
| Immigrants | Ghana | 3.2 /100 | #238 | Tragic 13.4% |
| Czechoslovakians | 3.0 /100 | #239 | Tragic 13.4% |