Swiss vs Menominee Single Male Poverty
COMPARE
Swiss
Menominee
Single Male Poverty
Single Male Poverty Comparison
Swiss
Menominee
13.8%
SINGLE MALE POVERTY
0.3/ 100
METRIC RATING
260th/ 347
METRIC RANK
17.7%
SINGLE MALE POVERTY
0.0/ 100
METRIC RATING
327th/ 347
METRIC RANK
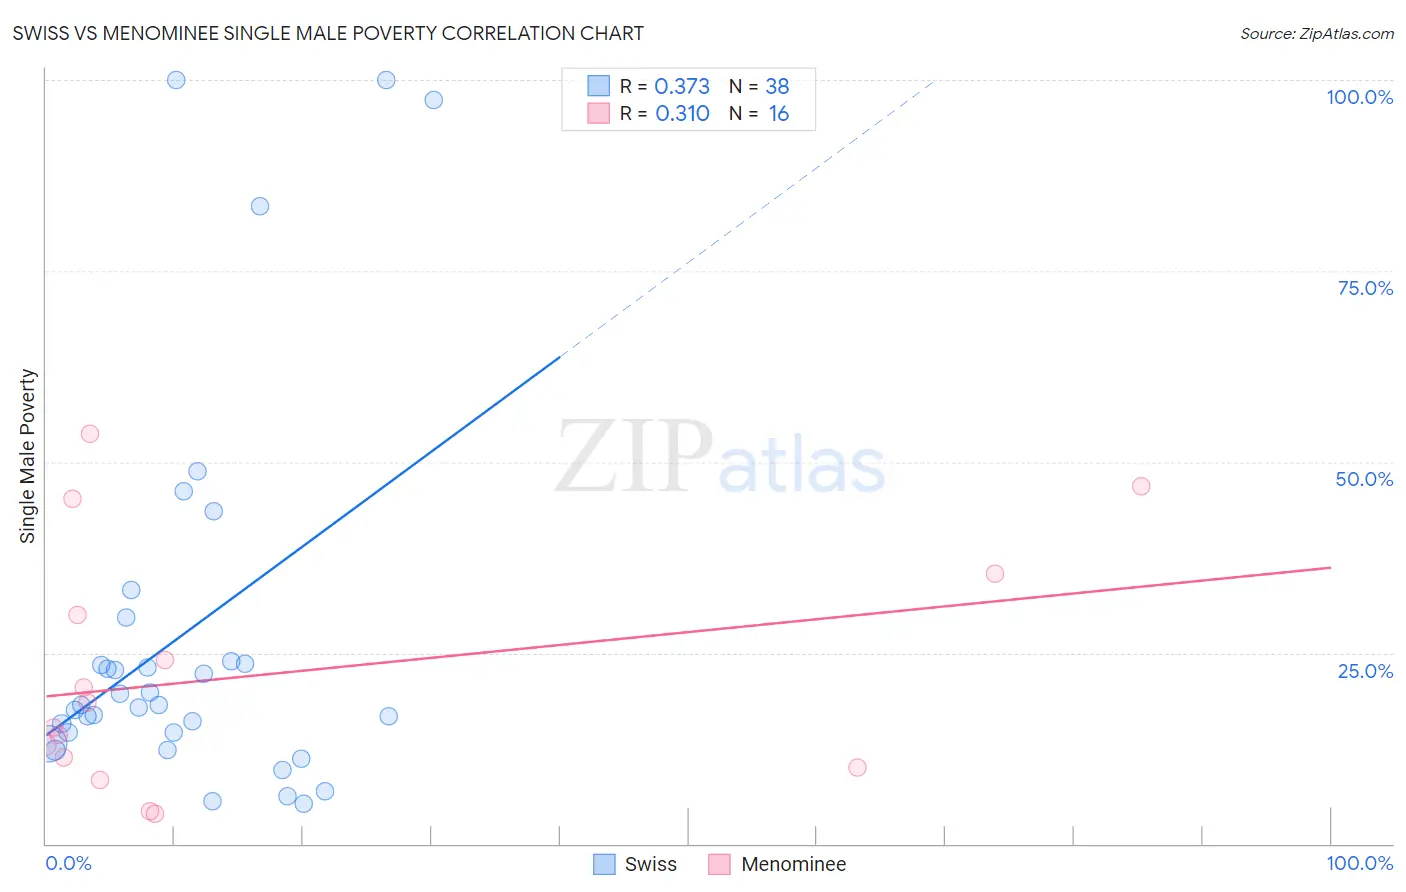
Swiss vs Menominee Single Male Poverty Correlation Chart
The statistical analysis conducted on geographies consisting of 396,994,211 people shows a mild positive correlation between the proportion of Swiss and poverty level among single males in the United States with a correlation coefficient (R) of 0.373 and weighted average of 13.8%. Similarly, the statistical analysis conducted on geographies consisting of 44,140,338 people shows a mild positive correlation between the proportion of Menominee and poverty level among single males in the United States with a correlation coefficient (R) of 0.310 and weighted average of 17.7%, a difference of 28.6%.
Single Male Poverty Correlation Summary
| Measurement | Swiss | Menominee |
| Minimum | 5.3% | 3.9% |
| Maximum | 100.0% | 53.7% |
| Range | 94.7% | 49.8% |
| Mean | 27.6% | 22.1% |
| Median | 18.2% | 16.8% |
| Interquartile 25% (IQ1) | 14.5% | 10.7% |
| Interquartile 75% (IQ3) | 23.8% | 32.6% |
| Interquartile Range (IQR) | 9.3% | 22.0% |
| Standard Deviation (Sample) | 25.6% | 15.7% |
| Standard Deviation (Population) | 25.3% | 15.2% |
Similar Demographics by Single Male Poverty
Demographics Similar to Swiss by Single Male Poverty
In terms of single male poverty, the demographic groups most similar to Swiss are Hungarian (13.8%, a difference of 0.050%), Guatemalan (13.8%, a difference of 0.070%), Immigrants from Guatemala (13.8%, a difference of 0.11%), Immigrants from Central America (13.8%, a difference of 0.18%), and Fijian (13.8%, a difference of 0.22%).
| Demographics | Rating | Rank | Single Male Poverty |
| German Russians | 0.8 /100 | #253 | Tragic 13.6% |
| Sub-Saharan Africans | 0.5 /100 | #254 | Tragic 13.7% |
| Spaniards | 0.4 /100 | #255 | Tragic 13.7% |
| Immigrants | Belize | 0.4 /100 | #256 | Tragic 13.7% |
| Immigrants | Central America | 0.3 /100 | #257 | Tragic 13.8% |
| Immigrants | Guatemala | 0.3 /100 | #258 | Tragic 13.8% |
| Guatemalans | 0.3 /100 | #259 | Tragic 13.8% |
| Swiss | 0.3 /100 | #260 | Tragic 13.8% |
| Hungarians | 0.3 /100 | #261 | Tragic 13.8% |
| Fijians | 0.3 /100 | #262 | Tragic 13.8% |
| Cape Verdeans | 0.2 /100 | #263 | Tragic 13.8% |
| West Indians | 0.2 /100 | #264 | Tragic 13.8% |
| Immigrants | Congo | 0.2 /100 | #265 | Tragic 13.9% |
| Immigrants | Cabo Verde | 0.1 /100 | #266 | Tragic 13.9% |
| Germans | 0.1 /100 | #267 | Tragic 13.9% |
Demographics Similar to Menominee by Single Male Poverty
In terms of single male poverty, the demographic groups most similar to Menominee are Central American Indian (17.2%, a difference of 2.7%), Kiowa (18.3%, a difference of 3.3%), Colville (18.4%, a difference of 4.0%), Choctaw (17.0%, a difference of 4.3%), and Immigrants from Yemen (16.9%, a difference of 5.1%).
| Demographics | Rating | Rank | Single Male Poverty |
| Marshallese | 0.0 /100 | #320 | Tragic 16.4% |
| Osage | 0.0 /100 | #321 | Tragic 16.5% |
| Shoshone | 0.0 /100 | #322 | Tragic 16.7% |
| Creek | 0.0 /100 | #323 | Tragic 16.8% |
| Immigrants | Yemen | 0.0 /100 | #324 | Tragic 16.9% |
| Choctaw | 0.0 /100 | #325 | Tragic 17.0% |
| Central American Indians | 0.0 /100 | #326 | Tragic 17.2% |
| Menominee | 0.0 /100 | #327 | Tragic 17.7% |
| Kiowa | 0.0 /100 | #328 | Tragic 18.3% |
| Colville | 0.0 /100 | #329 | Tragic 18.4% |
| Cajuns | 0.0 /100 | #330 | Tragic 19.1% |
| Paiute | 0.0 /100 | #331 | Tragic 19.3% |
| Natives/Alaskans | 0.0 /100 | #332 | Tragic 19.6% |
| Inupiat | 0.0 /100 | #333 | Tragic 20.0% |
| Pima | 0.0 /100 | #334 | Tragic 20.2% |