Croatian vs Menominee Single Male Poverty
COMPARE
Croatian
Menominee
Single Male Poverty
Single Male Poverty Comparison
Croatians
Menominee
12.8%
SINGLE MALE POVERTY
48.9/ 100
METRIC RATING
175th/ 347
METRIC RANK
17.7%
SINGLE MALE POVERTY
0.0/ 100
METRIC RATING
327th/ 347
METRIC RANK
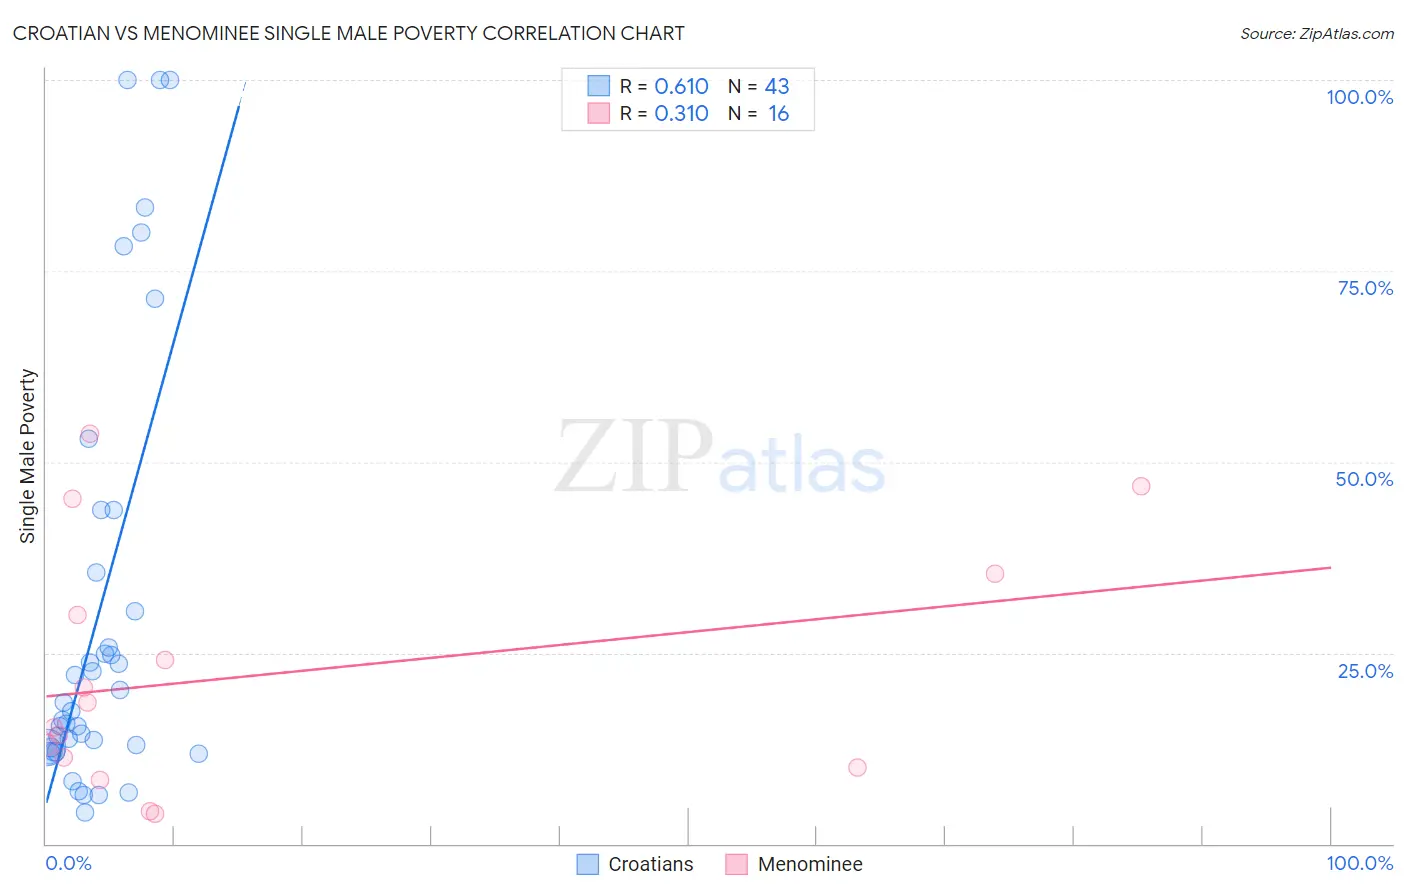
Croatian vs Menominee Single Male Poverty Correlation Chart
The statistical analysis conducted on geographies consisting of 328,638,760 people shows a significant positive correlation between the proportion of Croatians and poverty level among single males in the United States with a correlation coefficient (R) of 0.610 and weighted average of 12.8%. Similarly, the statistical analysis conducted on geographies consisting of 44,140,338 people shows a mild positive correlation between the proportion of Menominee and poverty level among single males in the United States with a correlation coefficient (R) of 0.310 and weighted average of 17.7%, a difference of 38.4%.
Single Male Poverty Correlation Summary
| Measurement | Croatian | Menominee |
| Minimum | 4.2% | 3.9% |
| Maximum | 100.0% | 53.7% |
| Range | 95.8% | 49.8% |
| Mean | 29.9% | 22.1% |
| Median | 17.3% | 16.8% |
| Interquartile 25% (IQ1) | 12.5% | 10.7% |
| Interquartile 75% (IQ3) | 35.6% | 32.6% |
| Interquartile Range (IQR) | 23.0% | 22.0% |
| Standard Deviation (Sample) | 28.1% | 15.7% |
| Standard Deviation (Population) | 27.7% | 15.2% |
Similar Demographics by Single Male Poverty
Demographics Similar to Croatians by Single Male Poverty
In terms of single male poverty, the demographic groups most similar to Croatians are Syrian (12.8%, a difference of 0.020%), Costa Rican (12.8%, a difference of 0.060%), Immigrants from St. Vincent and the Grenadines (12.8%, a difference of 0.11%), South African (12.8%, a difference of 0.14%), and Danish (12.8%, a difference of 0.14%).
| Demographics | Rating | Rank | Single Male Poverty |
| Immigrants | Barbados | 57.7 /100 | #168 | Average 12.7% |
| Puget Sound Salish | 54.3 /100 | #169 | Average 12.8% |
| Guyanese | 52.0 /100 | #170 | Average 12.8% |
| South Africans | 51.5 /100 | #171 | Average 12.8% |
| Danes | 51.4 /100 | #172 | Average 12.8% |
| Immigrants | St. Vincent and the Grenadines | 50.9 /100 | #173 | Average 12.8% |
| Costa Ricans | 50.0 /100 | #174 | Average 12.8% |
| Croatians | 48.9 /100 | #175 | Average 12.8% |
| Syrians | 48.4 /100 | #176 | Average 12.8% |
| Immigrants | Canada | 44.8 /100 | #177 | Average 12.8% |
| Immigrants | Switzerland | 43.1 /100 | #178 | Average 12.8% |
| Israelis | 41.0 /100 | #179 | Average 12.9% |
| Immigrants | North America | 37.7 /100 | #180 | Fair 12.9% |
| Panamanians | 37.6 /100 | #181 | Fair 12.9% |
| Moroccans | 36.8 /100 | #182 | Fair 12.9% |
Demographics Similar to Menominee by Single Male Poverty
In terms of single male poverty, the demographic groups most similar to Menominee are Central American Indian (17.2%, a difference of 2.7%), Kiowa (18.3%, a difference of 3.3%), Colville (18.4%, a difference of 4.0%), Choctaw (17.0%, a difference of 4.3%), and Immigrants from Yemen (16.9%, a difference of 5.1%).
| Demographics | Rating | Rank | Single Male Poverty |
| Marshallese | 0.0 /100 | #320 | Tragic 16.4% |
| Osage | 0.0 /100 | #321 | Tragic 16.5% |
| Shoshone | 0.0 /100 | #322 | Tragic 16.7% |
| Creek | 0.0 /100 | #323 | Tragic 16.8% |
| Immigrants | Yemen | 0.0 /100 | #324 | Tragic 16.9% |
| Choctaw | 0.0 /100 | #325 | Tragic 17.0% |
| Central American Indians | 0.0 /100 | #326 | Tragic 17.2% |
| Menominee | 0.0 /100 | #327 | Tragic 17.7% |
| Kiowa | 0.0 /100 | #328 | Tragic 18.3% |
| Colville | 0.0 /100 | #329 | Tragic 18.4% |
| Cajuns | 0.0 /100 | #330 | Tragic 19.1% |
| Paiute | 0.0 /100 | #331 | Tragic 19.3% |
| Natives/Alaskans | 0.0 /100 | #332 | Tragic 19.6% |
| Inupiat | 0.0 /100 | #333 | Tragic 20.0% |
| Pima | 0.0 /100 | #334 | Tragic 20.2% |