Italian vs Menominee Single Male Poverty
COMPARE
Italian
Menominee
Single Male Poverty
Single Male Poverty Comparison
Italians
Menominee
13.1%
SINGLE MALE POVERTY
15.9/ 100
METRIC RATING
213th/ 347
METRIC RANK
17.7%
SINGLE MALE POVERTY
0.0/ 100
METRIC RATING
327th/ 347
METRIC RANK
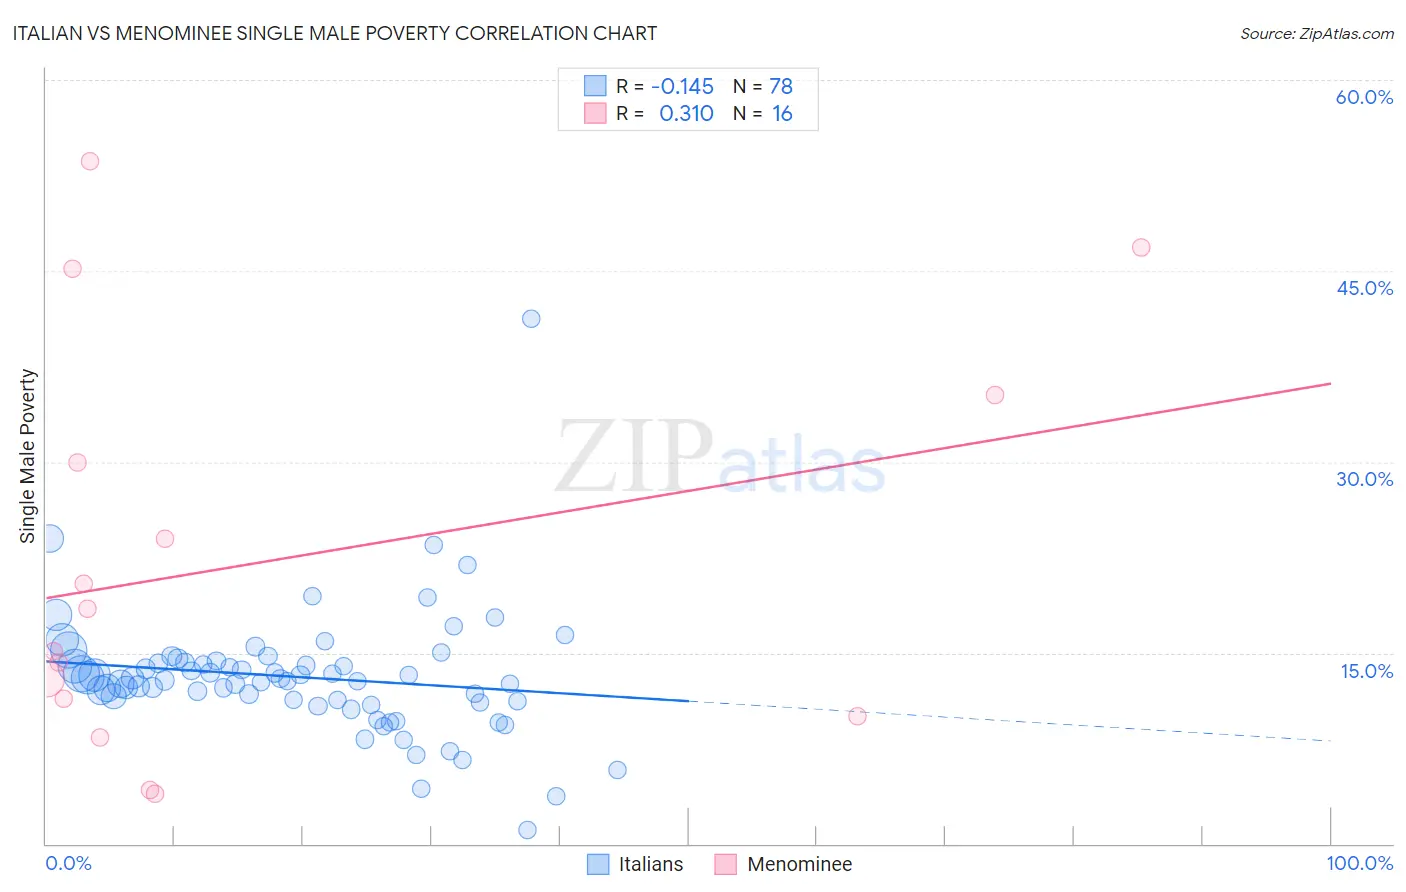
Italian vs Menominee Single Male Poverty Correlation Chart
The statistical analysis conducted on geographies consisting of 474,306,770 people shows a poor negative correlation between the proportion of Italians and poverty level among single males in the United States with a correlation coefficient (R) of -0.145 and weighted average of 13.1%. Similarly, the statistical analysis conducted on geographies consisting of 44,140,338 people shows a mild positive correlation between the proportion of Menominee and poverty level among single males in the United States with a correlation coefficient (R) of 0.310 and weighted average of 17.7%, a difference of 35.5%.
Single Male Poverty Correlation Summary
| Measurement | Italian | Menominee |
| Minimum | 1.1% | 3.9% |
| Maximum | 41.2% | 53.7% |
| Range | 40.1% | 49.8% |
| Mean | 13.1% | 22.1% |
| Median | 12.9% | 16.8% |
| Interquartile 25% (IQ1) | 11.2% | 10.7% |
| Interquartile 75% (IQ3) | 14.3% | 32.6% |
| Interquartile Range (IQR) | 3.1% | 22.0% |
| Standard Deviation (Sample) | 5.0% | 15.7% |
| Standard Deviation (Population) | 5.0% | 15.2% |
Similar Demographics by Single Male Poverty
Demographics Similar to Italians by Single Male Poverty
In terms of single male poverty, the demographic groups most similar to Italians are Senegalese (13.1%, a difference of 0.050%), Swedish (13.1%, a difference of 0.080%), Immigrants from Haiti (13.1%, a difference of 0.090%), Zimbabwean (13.1%, a difference of 0.090%), and Japanese (13.1%, a difference of 0.11%).
| Demographics | Rating | Rank | Single Male Poverty |
| Northern Europeans | 18.9 /100 | #206 | Poor 13.0% |
| Sudanese | 17.7 /100 | #207 | Poor 13.1% |
| Immigrants | Western Africa | 17.6 /100 | #208 | Poor 13.1% |
| Mexican American Indians | 17.5 /100 | #209 | Poor 13.1% |
| Immigrants | Haiti | 16.8 /100 | #210 | Poor 13.1% |
| Swedes | 16.8 /100 | #211 | Poor 13.1% |
| Senegalese | 16.4 /100 | #212 | Poor 13.1% |
| Italians | 15.9 /100 | #213 | Poor 13.1% |
| Zimbabweans | 14.9 /100 | #214 | Poor 13.1% |
| Japanese | 14.8 /100 | #215 | Poor 13.1% |
| Austrians | 13.9 /100 | #216 | Poor 13.1% |
| Bermudans | 13.0 /100 | #217 | Poor 13.1% |
| Scandinavians | 12.9 /100 | #218 | Poor 13.1% |
| Immigrants | Burma/Myanmar | 12.6 /100 | #219 | Poor 13.1% |
| Central Americans | 10.9 /100 | #220 | Poor 13.2% |
Demographics Similar to Menominee by Single Male Poverty
In terms of single male poverty, the demographic groups most similar to Menominee are Central American Indian (17.2%, a difference of 2.7%), Kiowa (18.3%, a difference of 3.3%), Colville (18.4%, a difference of 4.0%), Choctaw (17.0%, a difference of 4.3%), and Immigrants from Yemen (16.9%, a difference of 5.1%).
| Demographics | Rating | Rank | Single Male Poverty |
| Marshallese | 0.0 /100 | #320 | Tragic 16.4% |
| Osage | 0.0 /100 | #321 | Tragic 16.5% |
| Shoshone | 0.0 /100 | #322 | Tragic 16.7% |
| Creek | 0.0 /100 | #323 | Tragic 16.8% |
| Immigrants | Yemen | 0.0 /100 | #324 | Tragic 16.9% |
| Choctaw | 0.0 /100 | #325 | Tragic 17.0% |
| Central American Indians | 0.0 /100 | #326 | Tragic 17.2% |
| Menominee | 0.0 /100 | #327 | Tragic 17.7% |
| Kiowa | 0.0 /100 | #328 | Tragic 18.3% |
| Colville | 0.0 /100 | #329 | Tragic 18.4% |
| Cajuns | 0.0 /100 | #330 | Tragic 19.1% |
| Paiute | 0.0 /100 | #331 | Tragic 19.3% |
| Natives/Alaskans | 0.0 /100 | #332 | Tragic 19.6% |
| Inupiat | 0.0 /100 | #333 | Tragic 20.0% |
| Pima | 0.0 /100 | #334 | Tragic 20.2% |