Luxembourger vs Soviet Union Single Male Poverty
COMPARE
Luxembourger
Soviet Union
Single Male Poverty
Single Male Poverty Comparison
Luxembourgers
Soviet Union
13.4%
SINGLE MALE POVERTY
3.6/ 100
METRIC RATING
236th/ 347
METRIC RANK
11.5%
SINGLE MALE POVERTY
100.0/ 100
METRIC RATING
39th/ 347
METRIC RANK
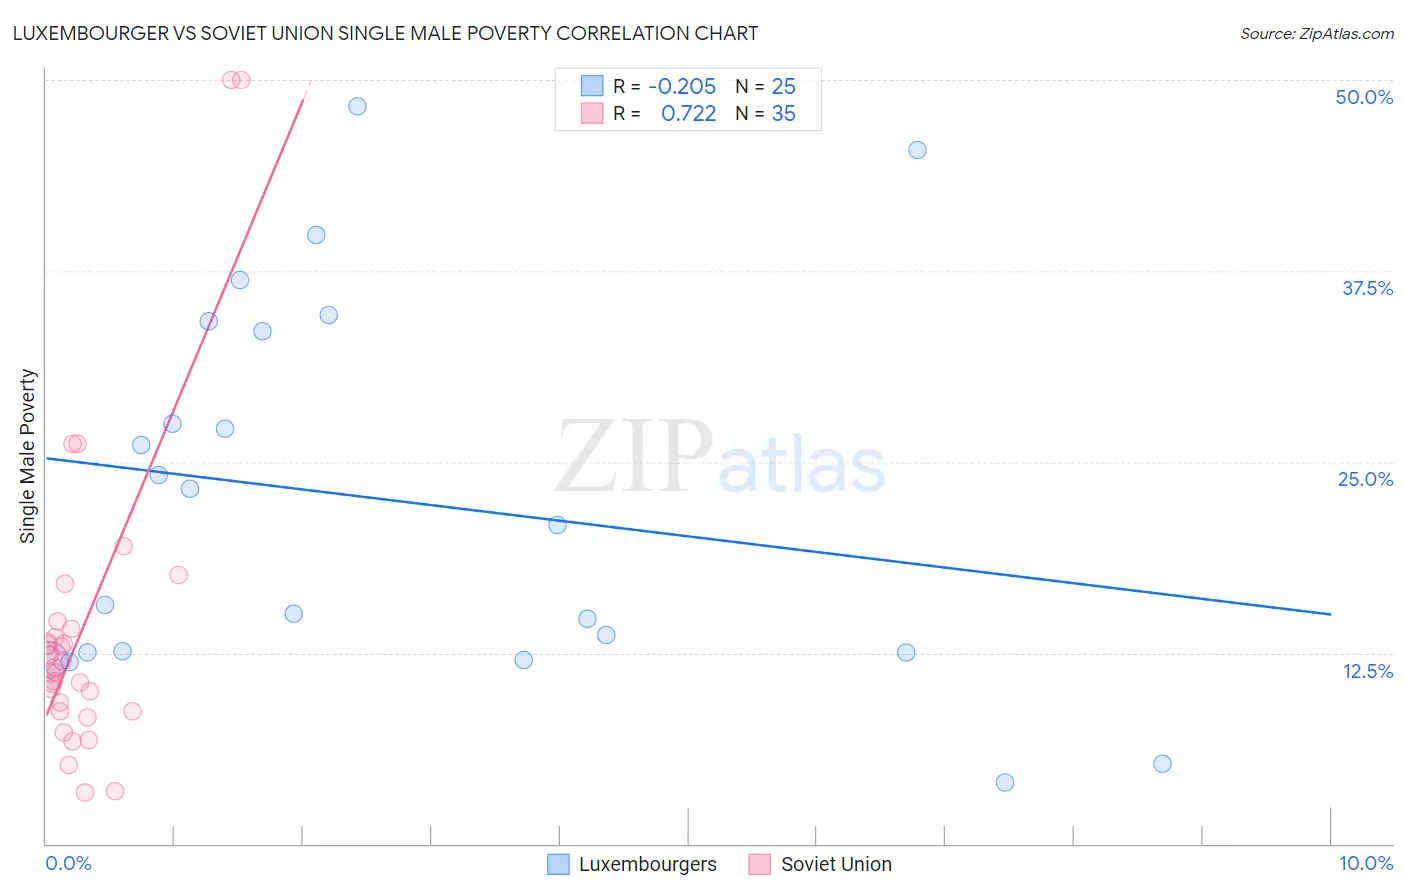
Luxembourger vs Soviet Union Single Male Poverty Correlation Chart
The statistical analysis conducted on geographies consisting of 133,228,824 people shows a weak negative correlation between the proportion of Luxembourgers and poverty level among single males in the United States with a correlation coefficient (R) of -0.205 and weighted average of 13.4%. Similarly, the statistical analysis conducted on geographies consisting of 42,355,679 people shows a strong positive correlation between the proportion of Soviet Union and poverty level among single males in the United States with a correlation coefficient (R) of 0.722 and weighted average of 11.5%, a difference of 16.5%.
Single Male Poverty Correlation Summary
| Measurement | Luxembourger | Soviet Union |
| Minimum | 4.0% | 3.3% |
| Maximum | 48.3% | 50.0% |
| Range | 44.3% | 46.7% |
| Mean | 22.6% | 14.0% |
| Median | 20.9% | 11.5% |
| Interquartile 25% (IQ1) | 12.5% | 8.7% |
| Interquartile 75% (IQ3) | 33.9% | 14.1% |
| Interquartile Range (IQR) | 21.4% | 5.4% |
| Standard Deviation (Sample) | 12.4% | 10.3% |
| Standard Deviation (Population) | 12.1% | 10.2% |
Similar Demographics by Single Male Poverty
Demographics Similar to Luxembourgers by Single Male Poverty
In terms of single male poverty, the demographic groups most similar to Luxembourgers are Bangladeshi (13.3%, a difference of 0.050%), British West Indian (13.4%, a difference of 0.060%), Canadian (13.3%, a difference of 0.15%), British (13.3%, a difference of 0.16%), and Immigrants from Ghana (13.4%, a difference of 0.16%).
| Demographics | Rating | Rank | Single Male Poverty |
| Europeans | 6.2 /100 | #229 | Tragic 13.3% |
| Ghanaians | 6.1 /100 | #230 | Tragic 13.3% |
| Slavs | 5.3 /100 | #231 | Tragic 13.3% |
| Immigrants | Caribbean | 5.0 /100 | #232 | Tragic 13.3% |
| British | 4.0 /100 | #233 | Tragic 13.3% |
| Canadians | 4.0 /100 | #234 | Tragic 13.3% |
| Bangladeshis | 3.7 /100 | #235 | Tragic 13.3% |
| Luxembourgers | 3.6 /100 | #236 | Tragic 13.4% |
| British West Indians | 3.4 /100 | #237 | Tragic 13.4% |
| Immigrants | Ghana | 3.2 /100 | #238 | Tragic 13.4% |
| Czechoslovakians | 3.0 /100 | #239 | Tragic 13.4% |
| Belizeans | 2.3 /100 | #240 | Tragic 13.4% |
| Immigrants | Germany | 2.1 /100 | #241 | Tragic 13.4% |
| Carpatho Rusyns | 2.1 /100 | #242 | Tragic 13.4% |
| Barbadians | 2.1 /100 | #243 | Tragic 13.4% |
Demographics Similar to Soviet Union by Single Male Poverty
In terms of single male poverty, the demographic groups most similar to Soviet Union are Sri Lankan (11.5%, a difference of 0.090%), Immigrants from Singapore (11.4%, a difference of 0.15%), Immigrants from Serbia (11.4%, a difference of 0.20%), Immigrants from South Eastern Asia (11.4%, a difference of 0.24%), and Immigrants from Ethiopia (11.4%, a difference of 0.27%).
| Demographics | Rating | Rank | Single Male Poverty |
| Immigrants | Eastern Asia | 100.0 /100 | #32 | Exceptional 11.4% |
| Immigrants | Vietnam | 100.0 /100 | #33 | Exceptional 11.4% |
| Immigrants | Ethiopia | 100.0 /100 | #34 | Exceptional 11.4% |
| Immigrants | South Eastern Asia | 100.0 /100 | #35 | Exceptional 11.4% |
| Immigrants | Serbia | 100.0 /100 | #36 | Exceptional 11.4% |
| Immigrants | Singapore | 100.0 /100 | #37 | Exceptional 11.4% |
| Sri Lankans | 100.0 /100 | #38 | Exceptional 11.5% |
| Soviet Union | 100.0 /100 | #39 | Exceptional 11.5% |
| Immigrants | Korea | 100.0 /100 | #40 | Exceptional 11.5% |
| Immigrants | Iraq | 99.9 /100 | #41 | Exceptional 11.5% |
| Egyptians | 99.9 /100 | #42 | Exceptional 11.5% |
| Immigrants | Peru | 99.9 /100 | #43 | Exceptional 11.5% |
| Immigrants | Cameroon | 99.9 /100 | #44 | Exceptional 11.5% |
| Immigrants | Poland | 99.9 /100 | #45 | Exceptional 11.5% |
| Immigrants | Bulgaria | 99.9 /100 | #46 | Exceptional 11.6% |