Luxembourger vs Immigrants from Netherlands Single Male Poverty
COMPARE
Luxembourger
Immigrants from Netherlands
Single Male Poverty
Single Male Poverty Comparison
Luxembourgers
Immigrants from Netherlands
13.4%
SINGLE MALE POVERTY
3.6/ 100
METRIC RATING
236th/ 347
METRIC RANK
12.5%
SINGLE MALE POVERTY
86.2/ 100
METRIC RATING
127th/ 347
METRIC RANK
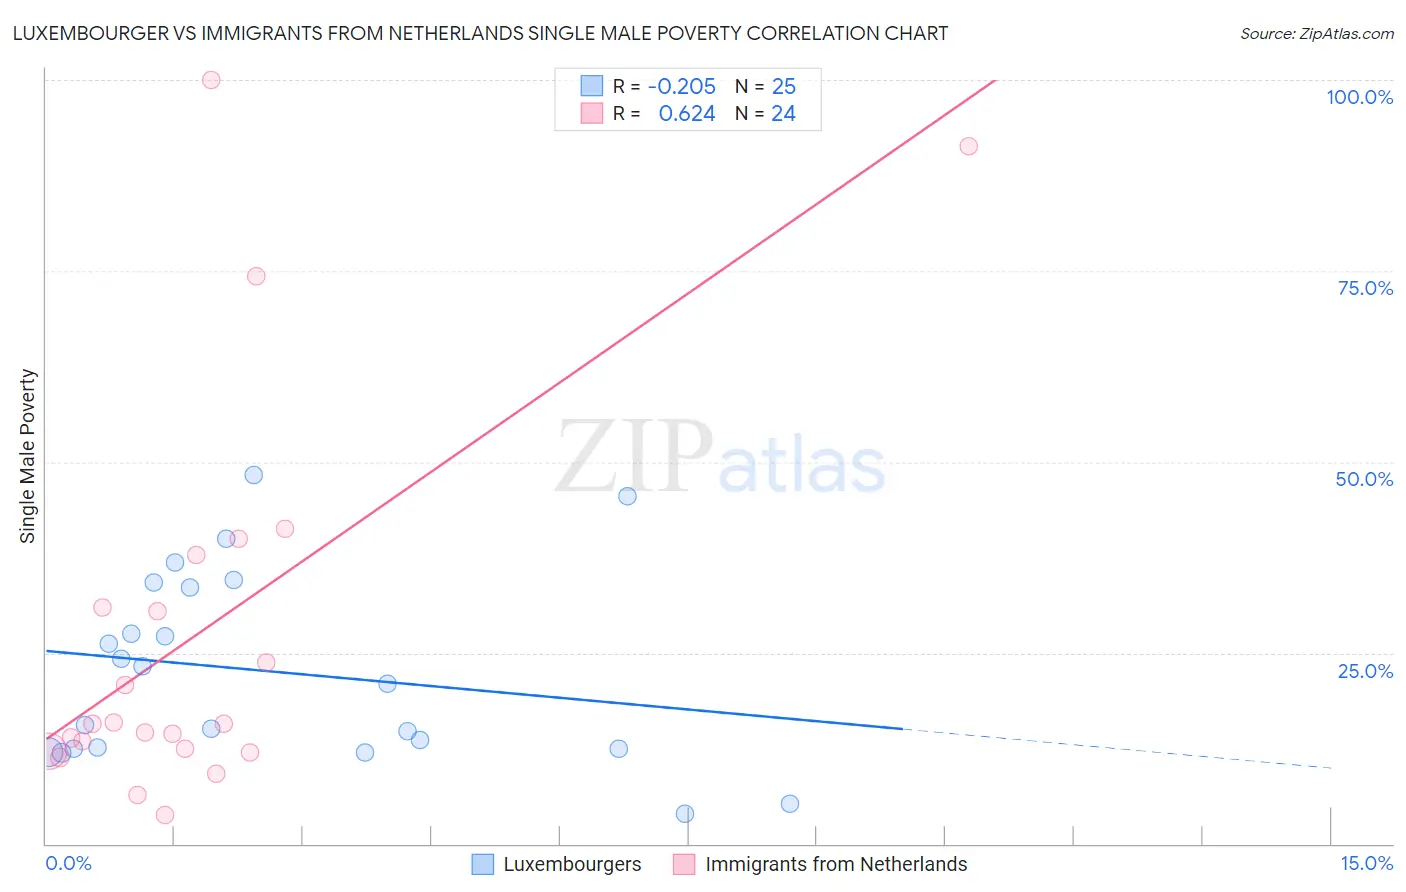
Luxembourger vs Immigrants from Netherlands Single Male Poverty Correlation Chart
The statistical analysis conducted on geographies consisting of 133,228,824 people shows a weak negative correlation between the proportion of Luxembourgers and poverty level among single males in the United States with a correlation coefficient (R) of -0.205 and weighted average of 13.4%. Similarly, the statistical analysis conducted on geographies consisting of 216,285,170 people shows a significant positive correlation between the proportion of Immigrants from Netherlands and poverty level among single males in the United States with a correlation coefficient (R) of 0.624 and weighted average of 12.5%, a difference of 6.9%.
Single Male Poverty Correlation Summary
| Measurement | Luxembourger | Immigrants from Netherlands |
| Minimum | 4.0% | 3.8% |
| Maximum | 48.3% | 100.0% |
| Range | 44.3% | 96.2% |
| Mean | 22.6% | 27.6% |
| Median | 20.9% | 15.7% |
| Interquartile 25% (IQ1) | 12.5% | 12.3% |
| Interquartile 75% (IQ3) | 33.9% | 34.4% |
| Interquartile Range (IQR) | 21.4% | 22.1% |
| Standard Deviation (Sample) | 12.4% | 26.0% |
| Standard Deviation (Population) | 12.1% | 25.4% |
Similar Demographics by Single Male Poverty
Demographics Similar to Luxembourgers by Single Male Poverty
In terms of single male poverty, the demographic groups most similar to Luxembourgers are Bangladeshi (13.3%, a difference of 0.050%), British West Indian (13.4%, a difference of 0.060%), Canadian (13.3%, a difference of 0.15%), British (13.3%, a difference of 0.16%), and Immigrants from Ghana (13.4%, a difference of 0.16%).
| Demographics | Rating | Rank | Single Male Poverty |
| Europeans | 6.2 /100 | #229 | Tragic 13.3% |
| Ghanaians | 6.1 /100 | #230 | Tragic 13.3% |
| Slavs | 5.3 /100 | #231 | Tragic 13.3% |
| Immigrants | Caribbean | 5.0 /100 | #232 | Tragic 13.3% |
| British | 4.0 /100 | #233 | Tragic 13.3% |
| Canadians | 4.0 /100 | #234 | Tragic 13.3% |
| Bangladeshis | 3.7 /100 | #235 | Tragic 13.3% |
| Luxembourgers | 3.6 /100 | #236 | Tragic 13.4% |
| British West Indians | 3.4 /100 | #237 | Tragic 13.4% |
| Immigrants | Ghana | 3.2 /100 | #238 | Tragic 13.4% |
| Czechoslovakians | 3.0 /100 | #239 | Tragic 13.4% |
| Belizeans | 2.3 /100 | #240 | Tragic 13.4% |
| Immigrants | Germany | 2.1 /100 | #241 | Tragic 13.4% |
| Carpatho Rusyns | 2.1 /100 | #242 | Tragic 13.4% |
| Barbadians | 2.1 /100 | #243 | Tragic 13.4% |
Demographics Similar to Immigrants from Netherlands by Single Male Poverty
In terms of single male poverty, the demographic groups most similar to Immigrants from Netherlands are Romanian (12.5%, a difference of 0.010%), Ecuadorian (12.5%, a difference of 0.040%), Immigrants from Sierra Leone (12.5%, a difference of 0.080%), Immigrants from Jordan (12.5%, a difference of 0.10%), and Russian (12.5%, a difference of 0.13%).
| Demographics | Rating | Rank | Single Male Poverty |
| Venezuelans | 89.4 /100 | #120 | Excellent 12.4% |
| Icelanders | 88.2 /100 | #121 | Excellent 12.5% |
| Serbians | 87.9 /100 | #122 | Excellent 12.5% |
| Immigrants | Kenya | 87.6 /100 | #123 | Excellent 12.5% |
| Russians | 87.3 /100 | #124 | Excellent 12.5% |
| Immigrants | Jordan | 87.1 /100 | #125 | Excellent 12.5% |
| Romanians | 86.4 /100 | #126 | Excellent 12.5% |
| Immigrants | Netherlands | 86.2 /100 | #127 | Excellent 12.5% |
| Ecuadorians | 85.9 /100 | #128 | Excellent 12.5% |
| Immigrants | Sierra Leone | 85.5 /100 | #129 | Excellent 12.5% |
| Immigrants | Nicaragua | 84.8 /100 | #130 | Excellent 12.5% |
| Immigrants | Northern Europe | 83.7 /100 | #131 | Excellent 12.5% |
| Salvadorans | 83.7 /100 | #132 | Excellent 12.5% |
| Immigrants | Western Asia | 83.4 /100 | #133 | Excellent 12.5% |
| Immigrants | Ecuador | 82.1 /100 | #134 | Excellent 12.5% |