Luxembourger vs Puget Sound Salish Single Male Poverty
COMPARE
Luxembourger
Puget Sound Salish
Single Male Poverty
Single Male Poverty Comparison
Luxembourgers
Puget Sound Salish
13.4%
SINGLE MALE POVERTY
3.6/ 100
METRIC RATING
236th/ 347
METRIC RANK
12.8%
SINGLE MALE POVERTY
54.3/ 100
METRIC RATING
169th/ 347
METRIC RANK
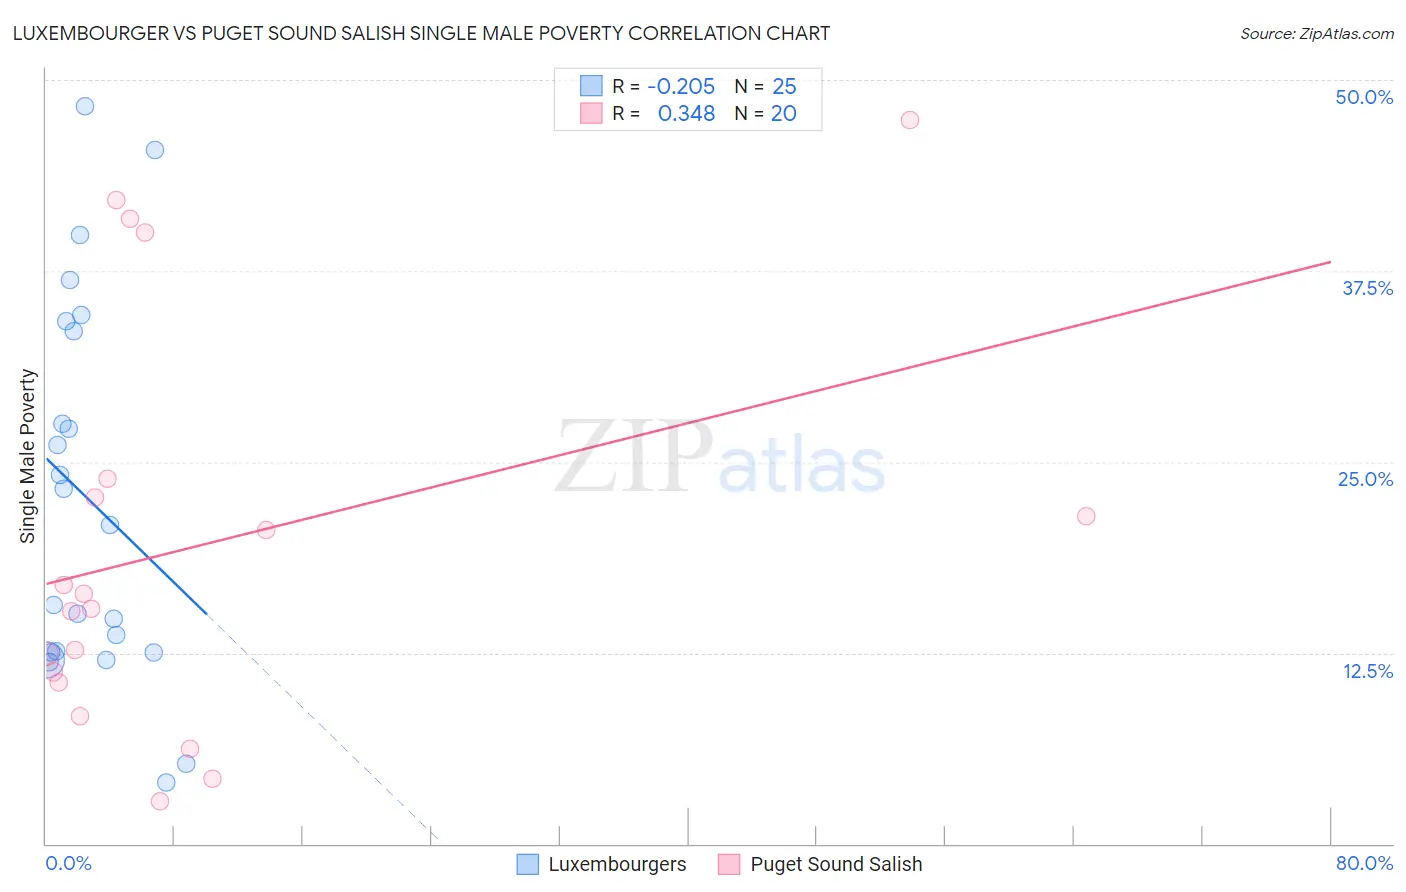
Luxembourger vs Puget Sound Salish Single Male Poverty Correlation Chart
The statistical analysis conducted on geographies consisting of 133,228,824 people shows a weak negative correlation between the proportion of Luxembourgers and poverty level among single males in the United States with a correlation coefficient (R) of -0.205 and weighted average of 13.4%. Similarly, the statistical analysis conducted on geographies consisting of 44,306,636 people shows a mild positive correlation between the proportion of Puget Sound Salish and poverty level among single males in the United States with a correlation coefficient (R) of 0.348 and weighted average of 12.8%, a difference of 4.6%.
Single Male Poverty Correlation Summary
| Measurement | Luxembourger | Puget Sound Salish |
| Minimum | 4.0% | 2.8% |
| Maximum | 48.3% | 47.4% |
| Range | 44.3% | 44.6% |
| Mean | 22.6% | 19.6% |
| Median | 20.9% | 15.9% |
| Interquartile 25% (IQ1) | 12.5% | 10.9% |
| Interquartile 75% (IQ3) | 33.9% | 23.3% |
| Interquartile Range (IQR) | 21.4% | 12.4% |
| Standard Deviation (Sample) | 12.4% | 13.2% |
| Standard Deviation (Population) | 12.1% | 12.9% |
Similar Demographics by Single Male Poverty
Demographics Similar to Luxembourgers by Single Male Poverty
In terms of single male poverty, the demographic groups most similar to Luxembourgers are Bangladeshi (13.3%, a difference of 0.050%), British West Indian (13.4%, a difference of 0.060%), Canadian (13.3%, a difference of 0.15%), British (13.3%, a difference of 0.16%), and Immigrants from Ghana (13.4%, a difference of 0.16%).
| Demographics | Rating | Rank | Single Male Poverty |
| Europeans | 6.2 /100 | #229 | Tragic 13.3% |
| Ghanaians | 6.1 /100 | #230 | Tragic 13.3% |
| Slavs | 5.3 /100 | #231 | Tragic 13.3% |
| Immigrants | Caribbean | 5.0 /100 | #232 | Tragic 13.3% |
| British | 4.0 /100 | #233 | Tragic 13.3% |
| Canadians | 4.0 /100 | #234 | Tragic 13.3% |
| Bangladeshis | 3.7 /100 | #235 | Tragic 13.3% |
| Luxembourgers | 3.6 /100 | #236 | Tragic 13.4% |
| British West Indians | 3.4 /100 | #237 | Tragic 13.4% |
| Immigrants | Ghana | 3.2 /100 | #238 | Tragic 13.4% |
| Czechoslovakians | 3.0 /100 | #239 | Tragic 13.4% |
| Belizeans | 2.3 /100 | #240 | Tragic 13.4% |
| Immigrants | Germany | 2.1 /100 | #241 | Tragic 13.4% |
| Carpatho Rusyns | 2.1 /100 | #242 | Tragic 13.4% |
| Barbadians | 2.1 /100 | #243 | Tragic 13.4% |
Demographics Similar to Puget Sound Salish by Single Male Poverty
In terms of single male poverty, the demographic groups most similar to Puget Sound Salish are Guyanese (12.8%, a difference of 0.12%), South African (12.8%, a difference of 0.15%), Danish (12.8%, a difference of 0.15%), Immigrants from Barbados (12.7%, a difference of 0.18%), and Immigrants from St. Vincent and the Grenadines (12.8%, a difference of 0.18%).
| Demographics | Rating | Rank | Single Male Poverty |
| Eastern Europeans | 63.3 /100 | #162 | Good 12.7% |
| Palestinians | 63.1 /100 | #163 | Good 12.7% |
| Immigrants | Nigeria | 62.8 /100 | #164 | Good 12.7% |
| Immigrants | Cambodia | 62.2 /100 | #165 | Good 12.7% |
| Immigrants | Guyana | 60.5 /100 | #166 | Good 12.7% |
| Immigrants | Sudan | 58.2 /100 | #167 | Average 12.7% |
| Immigrants | Barbados | 57.7 /100 | #168 | Average 12.7% |
| Puget Sound Salish | 54.3 /100 | #169 | Average 12.8% |
| Guyanese | 52.0 /100 | #170 | Average 12.8% |
| South Africans | 51.5 /100 | #171 | Average 12.8% |
| Danes | 51.4 /100 | #172 | Average 12.8% |
| Immigrants | St. Vincent and the Grenadines | 50.9 /100 | #173 | Average 12.8% |
| Costa Ricans | 50.0 /100 | #174 | Average 12.8% |
| Croatians | 48.9 /100 | #175 | Average 12.8% |
| Syrians | 48.4 /100 | #176 | Average 12.8% |