Lumbee vs Afghan Poverty
COMPARE
Lumbee
Afghan
Poverty
Poverty Comparison
Lumbee
Afghans
21.9%
POVERTY
0.0/ 100
METRIC RATING
344th/ 347
METRIC RANK
12.0%
POVERTY
74.9/ 100
METRIC RATING
146th/ 347
METRIC RANK
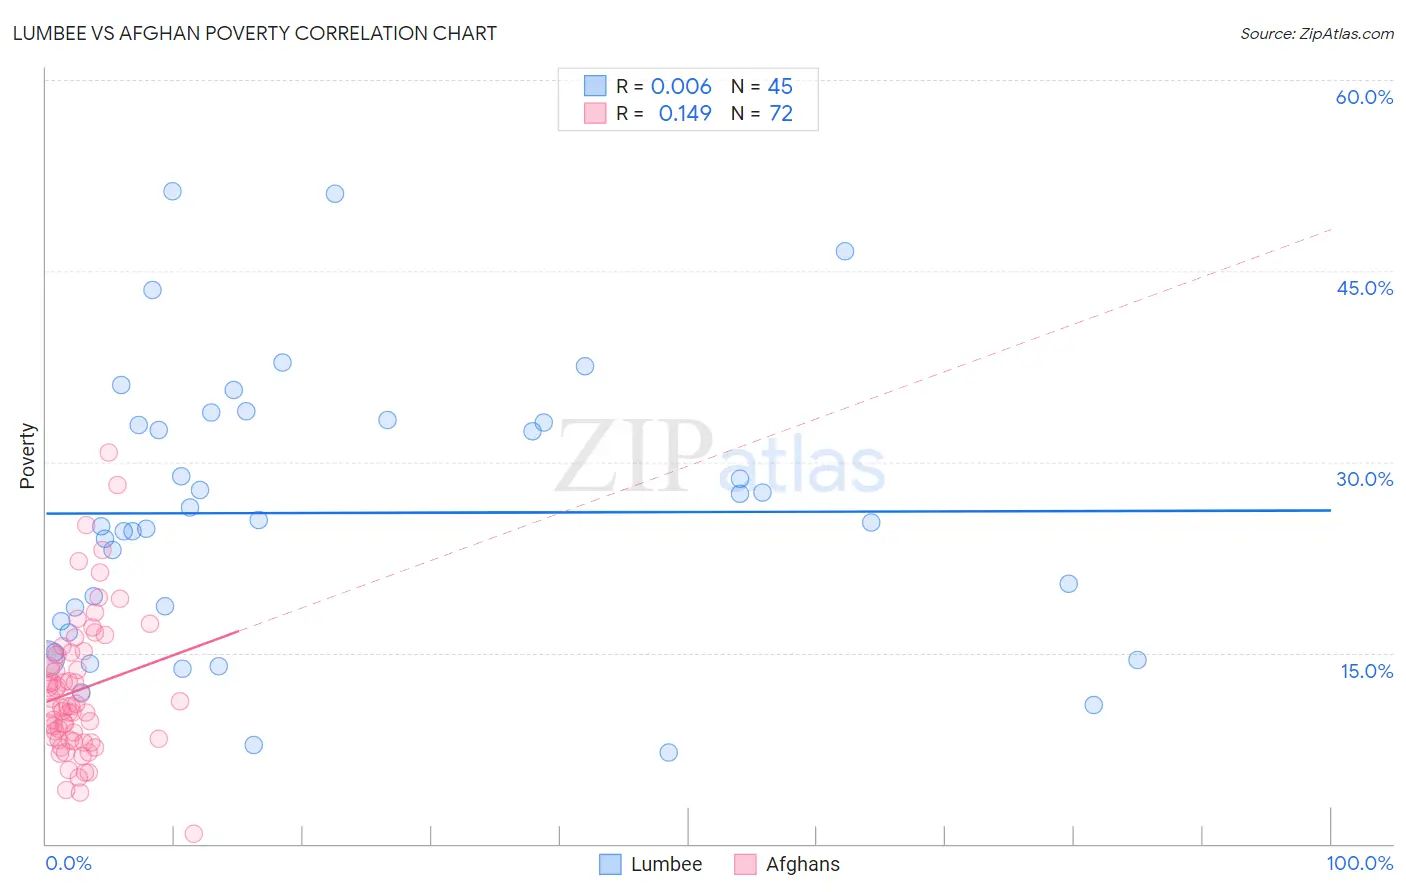
Lumbee vs Afghan Poverty Correlation Chart
The statistical analysis conducted on geographies consisting of 92,257,257 people shows no correlation between the proportion of Lumbee and poverty level in the United States with a correlation coefficient (R) of 0.006 and weighted average of 21.9%. Similarly, the statistical analysis conducted on geographies consisting of 148,816,997 people shows a poor positive correlation between the proportion of Afghans and poverty level in the United States with a correlation coefficient (R) of 0.149 and weighted average of 12.0%, a difference of 82.7%.
Poverty Correlation Summary
| Measurement | Lumbee | Afghan |
| Minimum | 7.2% | 0.81% |
| Maximum | 51.2% | 30.8% |
| Range | 44.0% | 30.0% |
| Mean | 26.0% | 12.1% |
| Median | 25.2% | 10.8% |
| Interquartile 25% (IQ1) | 17.0% | 8.2% |
| Interquartile 75% (IQ3) | 33.2% | 14.9% |
| Interquartile Range (IQR) | 16.2% | 6.7% |
| Standard Deviation (Sample) | 10.8% | 5.5% |
| Standard Deviation (Population) | 10.7% | 5.5% |
Similar Demographics by Poverty
Demographics Similar to Lumbee by Poverty
In terms of poverty, the demographic groups most similar to Lumbee are Pima (21.9%, a difference of 0.26%), Immigrants from Yemen (21.5%, a difference of 1.9%), Hopi (20.8%, a difference of 5.1%), Yup'ik (20.8%, a difference of 5.3%), and Navajo (23.1%, a difference of 5.4%).
| Demographics | Rating | Rank | Poverty |
| Houma | 0.0 /100 | #333 | Tragic 18.4% |
| Apache | 0.0 /100 | #334 | Tragic 18.4% |
| Cheyenne | 0.0 /100 | #335 | Tragic 18.9% |
| Pueblo | 0.0 /100 | #336 | Tragic 19.4% |
| Sioux | 0.0 /100 | #337 | Tragic 19.8% |
| Yuman | 0.0 /100 | #338 | Tragic 20.2% |
| Crow | 0.0 /100 | #339 | Tragic 20.7% |
| Yup'ik | 0.0 /100 | #340 | Tragic 20.8% |
| Hopi | 0.0 /100 | #341 | Tragic 20.8% |
| Immigrants | Yemen | 0.0 /100 | #342 | Tragic 21.5% |
| Pima | 0.0 /100 | #343 | Tragic 21.9% |
| Lumbee | 0.0 /100 | #344 | Tragic 21.9% |
| Navajo | 0.0 /100 | #345 | Tragic 23.1% |
| Puerto Ricans | 0.0 /100 | #346 | Tragic 23.7% |
| Tohono O'odham | 0.0 /100 | #347 | Tragic 24.4% |
Demographics Similar to Afghans by Poverty
In terms of poverty, the demographic groups most similar to Afghans are Syrian (12.0%, a difference of 0.030%), Immigrants from Bosnia and Herzegovina (12.0%, a difference of 0.16%), Immigrants from Germany (12.0%, a difference of 0.28%), Immigrants from Malaysia (12.0%, a difference of 0.28%), and Immigrants from Kazakhstan (12.0%, a difference of 0.33%).
| Demographics | Rating | Rank | Poverty |
| Pakistanis | 82.2 /100 | #139 | Excellent 11.9% |
| Immigrants | Peru | 81.1 /100 | #140 | Excellent 11.9% |
| Immigrants | France | 80.5 /100 | #141 | Excellent 11.9% |
| Basques | 80.4 /100 | #142 | Excellent 11.9% |
| Brazilians | 79.7 /100 | #143 | Good 11.9% |
| Icelanders | 77.9 /100 | #144 | Good 11.9% |
| Syrians | 75.1 /100 | #145 | Good 12.0% |
| Afghans | 74.9 /100 | #146 | Good 12.0% |
| Immigrants | Bosnia and Herzegovina | 73.7 /100 | #147 | Good 12.0% |
| Immigrants | Germany | 72.7 /100 | #148 | Good 12.0% |
| Immigrants | Malaysia | 72.7 /100 | #149 | Good 12.0% |
| Immigrants | Kazakhstan | 72.3 /100 | #150 | Good 12.0% |
| Samoans | 71.9 /100 | #151 | Good 12.0% |
| Armenians | 67.6 /100 | #152 | Good 12.1% |
| Immigrants | Northern Africa | 63.9 /100 | #153 | Good 12.1% |