Lumbee vs Tongan Poverty
COMPARE
Lumbee
Tongan
Poverty
Poverty Comparison
Lumbee
Tongans
21.9%
POVERTY
0.0/ 100
METRIC RATING
344th/ 347
METRIC RANK
10.8%
POVERTY
99.4/ 100
METRIC RATING
35th/ 347
METRIC RANK
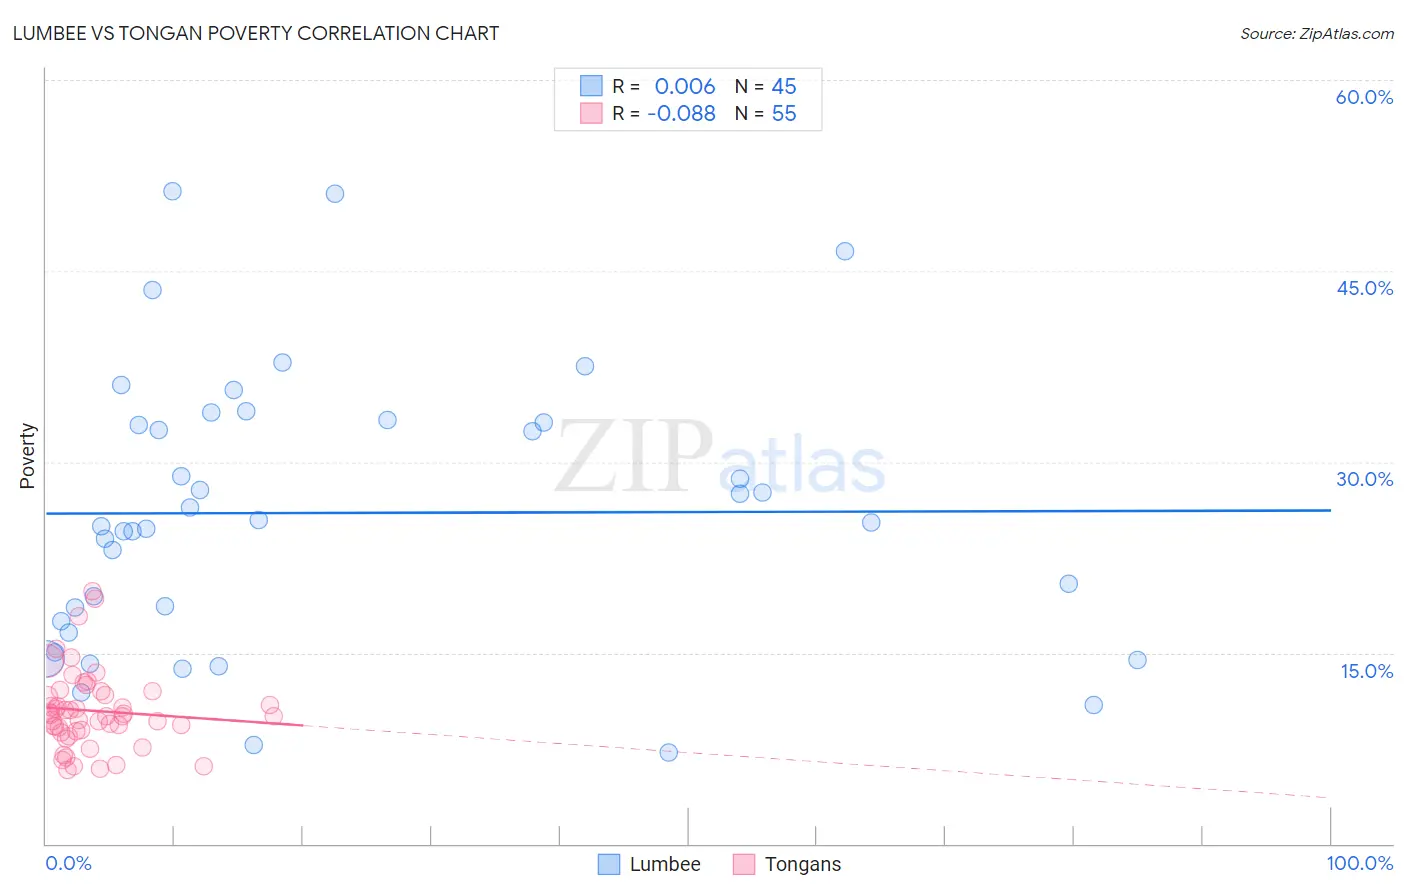
Lumbee vs Tongan Poverty Correlation Chart
The statistical analysis conducted on geographies consisting of 92,257,257 people shows no correlation between the proportion of Lumbee and poverty level in the United States with a correlation coefficient (R) of 0.006 and weighted average of 21.9%. Similarly, the statistical analysis conducted on geographies consisting of 102,864,002 people shows a slight negative correlation between the proportion of Tongans and poverty level in the United States with a correlation coefficient (R) of -0.088 and weighted average of 10.8%, a difference of 102.6%.
Poverty Correlation Summary
| Measurement | Lumbee | Tongan |
| Minimum | 7.2% | 5.8% |
| Maximum | 51.2% | 19.8% |
| Range | 44.0% | 14.1% |
| Mean | 26.0% | 10.4% |
| Median | 25.2% | 10.1% |
| Interquartile 25% (IQ1) | 17.0% | 8.8% |
| Interquartile 75% (IQ3) | 33.2% | 12.0% |
| Interquartile Range (IQR) | 16.2% | 3.1% |
| Standard Deviation (Sample) | 10.8% | 3.1% |
| Standard Deviation (Population) | 10.7% | 3.0% |
Similar Demographics by Poverty
Demographics Similar to Lumbee by Poverty
In terms of poverty, the demographic groups most similar to Lumbee are Pima (21.9%, a difference of 0.26%), Immigrants from Yemen (21.5%, a difference of 1.9%), Hopi (20.8%, a difference of 5.1%), Yup'ik (20.8%, a difference of 5.3%), and Navajo (23.1%, a difference of 5.4%).
| Demographics | Rating | Rank | Poverty |
| Houma | 0.0 /100 | #333 | Tragic 18.4% |
| Apache | 0.0 /100 | #334 | Tragic 18.4% |
| Cheyenne | 0.0 /100 | #335 | Tragic 18.9% |
| Pueblo | 0.0 /100 | #336 | Tragic 19.4% |
| Sioux | 0.0 /100 | #337 | Tragic 19.8% |
| Yuman | 0.0 /100 | #338 | Tragic 20.2% |
| Crow | 0.0 /100 | #339 | Tragic 20.7% |
| Yup'ik | 0.0 /100 | #340 | Tragic 20.8% |
| Hopi | 0.0 /100 | #341 | Tragic 20.8% |
| Immigrants | Yemen | 0.0 /100 | #342 | Tragic 21.5% |
| Pima | 0.0 /100 | #343 | Tragic 21.9% |
| Lumbee | 0.0 /100 | #344 | Tragic 21.9% |
| Navajo | 0.0 /100 | #345 | Tragic 23.1% |
| Puerto Ricans | 0.0 /100 | #346 | Tragic 23.7% |
| Tohono O'odham | 0.0 /100 | #347 | Tragic 24.4% |
Demographics Similar to Tongans by Poverty
In terms of poverty, the demographic groups most similar to Tongans are Immigrants from Poland (10.8%, a difference of 0.040%), Cypriot (10.8%, a difference of 0.080%), Macedonian (10.8%, a difference of 0.14%), Immigrants from Greece (10.8%, a difference of 0.17%), and Czech (10.8%, a difference of 0.22%).
| Demographics | Rating | Rank | Poverty |
| Immigrants | Korea | 99.5 /100 | #28 | Exceptional 10.7% |
| Greeks | 99.5 /100 | #29 | Exceptional 10.7% |
| Danes | 99.5 /100 | #30 | Exceptional 10.7% |
| Poles | 99.5 /100 | #31 | Exceptional 10.7% |
| Iranians | 99.5 /100 | #32 | Exceptional 10.7% |
| Macedonians | 99.4 /100 | #33 | Exceptional 10.8% |
| Immigrants | Poland | 99.4 /100 | #34 | Exceptional 10.8% |
| Tongans | 99.4 /100 | #35 | Exceptional 10.8% |
| Cypriots | 99.3 /100 | #36 | Exceptional 10.8% |
| Immigrants | Greece | 99.3 /100 | #37 | Exceptional 10.8% |
| Czechs | 99.3 /100 | #38 | Exceptional 10.8% |
| Immigrants | Pakistan | 99.3 /100 | #39 | Exceptional 10.8% |
| Russians | 99.3 /100 | #40 | Exceptional 10.9% |
| Immigrants | Iran | 99.2 /100 | #41 | Exceptional 10.9% |
| Koreans | 99.2 /100 | #42 | Exceptional 10.9% |