Lumbee vs Immigrants from Western Africa Poverty
COMPARE
Lumbee
Immigrants from Western Africa
Poverty
Poverty Comparison
Lumbee
Immigrants from Western Africa
21.9%
POVERTY
0.0/ 100
METRIC RATING
344th/ 347
METRIC RANK
14.1%
POVERTY
0.2/ 100
METRIC RATING
248th/ 347
METRIC RANK
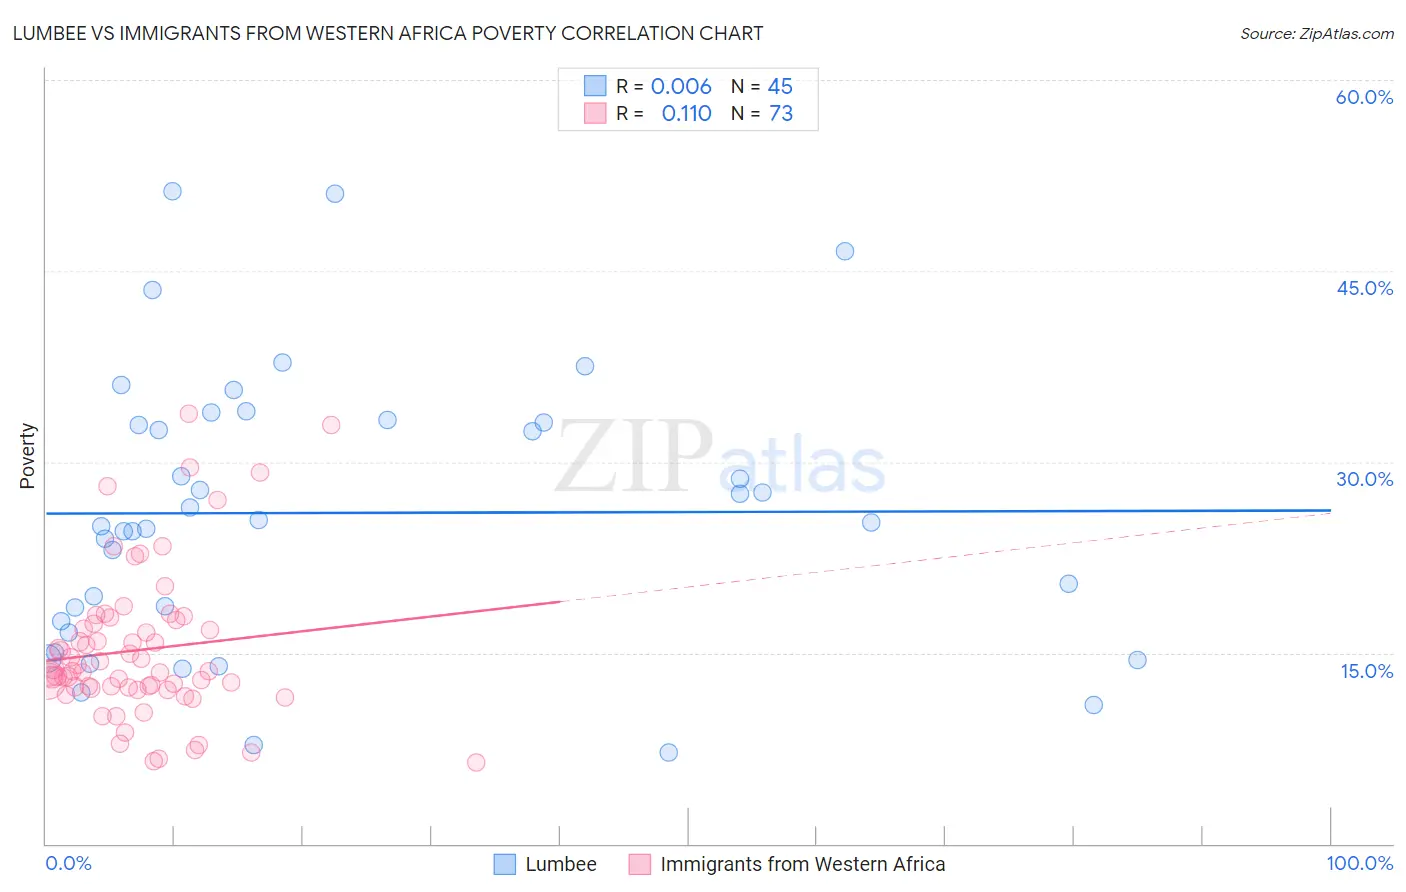
Lumbee vs Immigrants from Western Africa Poverty Correlation Chart
The statistical analysis conducted on geographies consisting of 92,257,257 people shows no correlation between the proportion of Lumbee and poverty level in the United States with a correlation coefficient (R) of 0.006 and weighted average of 21.9%. Similarly, the statistical analysis conducted on geographies consisting of 357,561,912 people shows a poor positive correlation between the proportion of Immigrants from Western Africa and poverty level in the United States with a correlation coefficient (R) of 0.110 and weighted average of 14.1%, a difference of 54.9%.
Poverty Correlation Summary
| Measurement | Lumbee | Immigrants from Western Africa |
| Minimum | 7.2% | 6.4% |
| Maximum | 51.2% | 33.8% |
| Range | 44.0% | 27.5% |
| Mean | 26.0% | 15.2% |
| Median | 25.2% | 13.5% |
| Interquartile 25% (IQ1) | 17.0% | 12.3% |
| Interquartile 75% (IQ3) | 33.2% | 17.5% |
| Interquartile Range (IQR) | 16.2% | 5.2% |
| Standard Deviation (Sample) | 10.8% | 5.9% |
| Standard Deviation (Population) | 10.7% | 5.8% |
Similar Demographics by Poverty
Demographics Similar to Lumbee by Poverty
In terms of poverty, the demographic groups most similar to Lumbee are Pima (21.9%, a difference of 0.26%), Immigrants from Yemen (21.5%, a difference of 1.9%), Hopi (20.8%, a difference of 5.1%), Yup'ik (20.8%, a difference of 5.3%), and Navajo (23.1%, a difference of 5.4%).
| Demographics | Rating | Rank | Poverty |
| Houma | 0.0 /100 | #333 | Tragic 18.4% |
| Apache | 0.0 /100 | #334 | Tragic 18.4% |
| Cheyenne | 0.0 /100 | #335 | Tragic 18.9% |
| Pueblo | 0.0 /100 | #336 | Tragic 19.4% |
| Sioux | 0.0 /100 | #337 | Tragic 19.8% |
| Yuman | 0.0 /100 | #338 | Tragic 20.2% |
| Crow | 0.0 /100 | #339 | Tragic 20.7% |
| Yup'ik | 0.0 /100 | #340 | Tragic 20.8% |
| Hopi | 0.0 /100 | #341 | Tragic 20.8% |
| Immigrants | Yemen | 0.0 /100 | #342 | Tragic 21.5% |
| Pima | 0.0 /100 | #343 | Tragic 21.9% |
| Lumbee | 0.0 /100 | #344 | Tragic 21.9% |
| Navajo | 0.0 /100 | #345 | Tragic 23.1% |
| Puerto Ricans | 0.0 /100 | #346 | Tragic 23.7% |
| Tohono O'odham | 0.0 /100 | #347 | Tragic 24.4% |
Demographics Similar to Immigrants from Western Africa by Poverty
In terms of poverty, the demographic groups most similar to Immigrants from Western Africa are Liberian (14.1%, a difference of 0.020%), Immigrants from Ghana (14.2%, a difference of 0.090%), Potawatomi (14.1%, a difference of 0.30%), Cree (14.2%, a difference of 0.39%), and Immigrants from Burma/Myanmar (14.2%, a difference of 0.48%).
| Demographics | Rating | Rank | Poverty |
| Salvadorans | 0.4 /100 | #241 | Tragic 14.0% |
| Ecuadorians | 0.4 /100 | #242 | Tragic 14.0% |
| Sudanese | 0.3 /100 | #243 | Tragic 14.0% |
| Nepalese | 0.3 /100 | #244 | Tragic 14.0% |
| Immigrants | Sudan | 0.3 /100 | #245 | Tragic 14.1% |
| Potawatomi | 0.3 /100 | #246 | Tragic 14.1% |
| Liberians | 0.2 /100 | #247 | Tragic 14.1% |
| Immigrants | Western Africa | 0.2 /100 | #248 | Tragic 14.1% |
| Immigrants | Ghana | 0.2 /100 | #249 | Tragic 14.2% |
| Cree | 0.2 /100 | #250 | Tragic 14.2% |
| Immigrants | Burma/Myanmar | 0.2 /100 | #251 | Tragic 14.2% |
| Spanish American Indians | 0.2 /100 | #252 | Tragic 14.2% |
| Immigrants | Trinidad and Tobago | 0.2 /100 | #253 | Tragic 14.2% |
| Immigrants | El Salvador | 0.1 /100 | #254 | Tragic 14.3% |
| Immigrants | Ecuador | 0.1 /100 | #255 | Tragic 14.3% |