Lumbee vs Afghan Family Households with Children
COMPARE
Lumbee
Afghan
Family Households with Children
Family Households with Children Comparison
Lumbee
Afghans
26.3%
FAMILY HOUSEHOLDS WITH CHILDREN
0.0/ 100
METRIC RATING
308th/ 347
METRIC RANK
30.2%
FAMILY HOUSEHOLDS WITH CHILDREN
100.0/ 100
METRIC RATING
13th/ 347
METRIC RANK
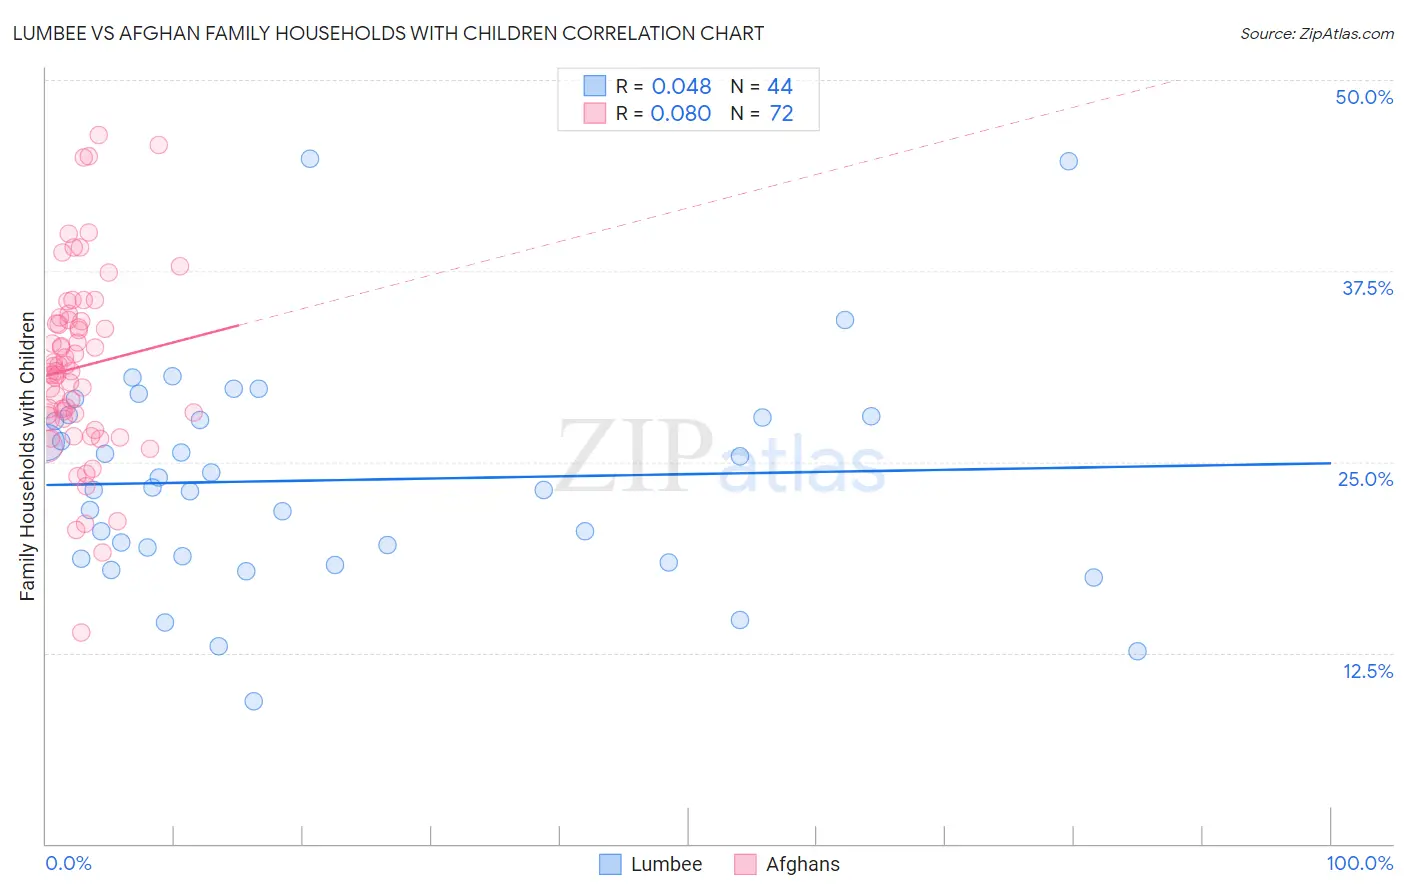
Lumbee vs Afghan Family Households with Children Correlation Chart
The statistical analysis conducted on geographies consisting of 92,262,389 people shows no correlation between the proportion of Lumbee and percentage of family households with children in the United States with a correlation coefficient (R) of 0.048 and weighted average of 26.3%. Similarly, the statistical analysis conducted on geographies consisting of 148,820,145 people shows a slight positive correlation between the proportion of Afghans and percentage of family households with children in the United States with a correlation coefficient (R) of 0.080 and weighted average of 30.2%, a difference of 14.8%.
Family Households with Children Correlation Summary
| Measurement | Lumbee | Afghan |
| Minimum | 9.3% | 13.8% |
| Maximum | 44.9% | 46.4% |
| Range | 35.5% | 32.5% |
| Mean | 23.8% | 31.2% |
| Median | 23.2% | 31.0% |
| Interquartile 25% (IQ1) | 18.7% | 27.8% |
| Interquartile 75% (IQ3) | 27.9% | 34.2% |
| Interquartile Range (IQR) | 9.2% | 6.4% |
| Standard Deviation (Sample) | 7.2% | 6.1% |
| Standard Deviation (Population) | 7.1% | 6.1% |
Similar Demographics by Family Households with Children
Demographics Similar to Lumbee by Family Households with Children
In terms of family households with children, the demographic groups most similar to Lumbee are West Indian (26.3%, a difference of 0.020%), Bermudan (26.3%, a difference of 0.10%), Immigrants from Somalia (26.3%, a difference of 0.11%), Guyanese (26.3%, a difference of 0.12%), and Immigrants from Bahamas (26.3%, a difference of 0.14%).
| Demographics | Rating | Rank | Family Households with Children |
| Immigrants | Trinidad and Tobago | 0.1 /100 | #301 | Tragic 26.4% |
| Serbians | 0.1 /100 | #302 | Tragic 26.4% |
| Immigrants | Guyana | 0.1 /100 | #303 | Tragic 26.3% |
| Immigrants | Bahamas | 0.1 /100 | #304 | Tragic 26.3% |
| Guyanese | 0.1 /100 | #305 | Tragic 26.3% |
| Bermudans | 0.1 /100 | #306 | Tragic 26.3% |
| West Indians | 0.0 /100 | #307 | Tragic 26.3% |
| Lumbee | 0.0 /100 | #308 | Tragic 26.3% |
| Immigrants | Somalia | 0.0 /100 | #309 | Tragic 26.3% |
| Marshallese | 0.0 /100 | #310 | Tragic 26.2% |
| Colville | 0.0 /100 | #311 | Tragic 26.2% |
| Immigrants | Czechoslovakia | 0.0 /100 | #312 | Tragic 26.2% |
| Cree | 0.0 /100 | #313 | Tragic 26.2% |
| French Canadians | 0.0 /100 | #314 | Tragic 26.1% |
| Immigrants | Norway | 0.0 /100 | #315 | Tragic 26.1% |
Demographics Similar to Afghans by Family Households with Children
In terms of family households with children, the demographic groups most similar to Afghans are Immigrants from Pakistan (30.2%, a difference of 0.24%), Bangladeshi (30.1%, a difference of 0.28%), Immigrants from South Central Asia (30.0%, a difference of 0.46%), Immigrants from Afghanistan (30.0%, a difference of 0.48%), and Hispanic or Latino (29.9%, a difference of 0.87%).
| Demographics | Rating | Rank | Family Households with Children |
| Immigrants | India | 100.0 /100 | #6 | Exceptional 31.0% |
| Immigrants | Central America | 100.0 /100 | #7 | Exceptional 31.0% |
| Yakama | 100.0 /100 | #8 | Exceptional 30.8% |
| Thais | 100.0 /100 | #9 | Exceptional 30.6% |
| Immigrants | Fiji | 100.0 /100 | #10 | Exceptional 30.5% |
| Nepalese | 100.0 /100 | #11 | Exceptional 30.5% |
| Immigrants | Pakistan | 100.0 /100 | #12 | Exceptional 30.2% |
| Afghans | 100.0 /100 | #13 | Exceptional 30.2% |
| Bangladeshis | 100.0 /100 | #14 | Exceptional 30.1% |
| Immigrants | South Central Asia | 100.0 /100 | #15 | Exceptional 30.0% |
| Immigrants | Afghanistan | 100.0 /100 | #16 | Exceptional 30.0% |
| Hispanics or Latinos | 100.0 /100 | #17 | Exceptional 29.9% |
| Salvadorans | 100.0 /100 | #18 | Exceptional 29.9% |
| Alaska Natives | 100.0 /100 | #19 | Exceptional 29.9% |
| Immigrants | El Salvador | 100.0 /100 | #20 | Exceptional 29.8% |