Jamaican vs Afghan Poverty
COMPARE
Jamaican
Afghan
Poverty
Poverty Comparison
Jamaicans
Afghans
14.4%
POVERTY
0.1/ 100
METRIC RATING
263rd/ 347
METRIC RANK
12.0%
POVERTY
74.9/ 100
METRIC RATING
146th/ 347
METRIC RANK
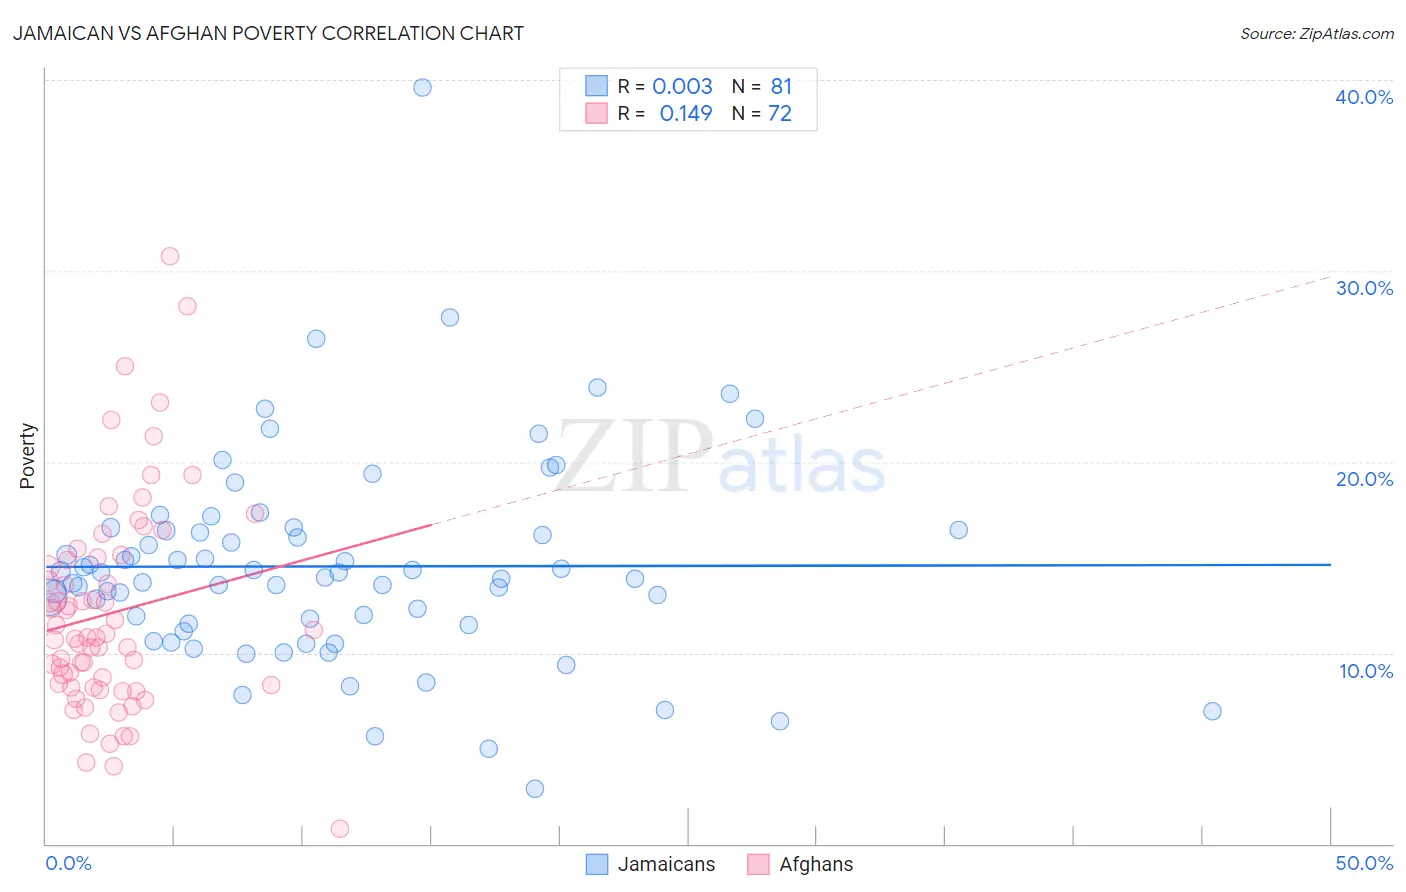
Jamaican vs Afghan Poverty Correlation Chart
The statistical analysis conducted on geographies consisting of 367,709,935 people shows no correlation between the proportion of Jamaicans and poverty level in the United States with a correlation coefficient (R) of 0.003 and weighted average of 14.4%. Similarly, the statistical analysis conducted on geographies consisting of 148,816,997 people shows a poor positive correlation between the proportion of Afghans and poverty level in the United States with a correlation coefficient (R) of 0.149 and weighted average of 12.0%, a difference of 20.3%.
Poverty Correlation Summary
| Measurement | Jamaican | Afghan |
| Minimum | 2.9% | 0.81% |
| Maximum | 39.6% | 30.8% |
| Range | 36.7% | 30.0% |
| Mean | 14.5% | 12.1% |
| Median | 13.9% | 10.8% |
| Interquartile 25% (IQ1) | 11.5% | 8.2% |
| Interquartile 75% (IQ3) | 16.4% | 14.9% |
| Interquartile Range (IQR) | 4.9% | 6.7% |
| Standard Deviation (Sample) | 5.4% | 5.5% |
| Standard Deviation (Population) | 5.4% | 5.5% |
Similar Demographics by Poverty
Demographics Similar to Jamaicans by Poverty
In terms of poverty, the demographic groups most similar to Jamaicans are Immigrants from Jamaica (14.4%, a difference of 0.090%), Immigrants from Guyana (14.5%, a difference of 0.21%), Immigrants from Liberia (14.4%, a difference of 0.35%), Guyanese (14.5%, a difference of 0.38%), and Cherokee (14.4%, a difference of 0.51%).
| Demographics | Rating | Rank | Poverty |
| Mexican American Indians | 0.1 /100 | #256 | Tragic 14.3% |
| Trinidadians and Tobagonians | 0.1 /100 | #257 | Tragic 14.3% |
| Ottawa | 0.1 /100 | #258 | Tragic 14.3% |
| Immigrants | Nicaragua | 0.1 /100 | #259 | Tragic 14.3% |
| Cape Verdeans | 0.1 /100 | #260 | Tragic 14.4% |
| Cherokee | 0.1 /100 | #261 | Tragic 14.4% |
| Immigrants | Liberia | 0.1 /100 | #262 | Tragic 14.4% |
| Jamaicans | 0.1 /100 | #263 | Tragic 14.4% |
| Immigrants | Jamaica | 0.1 /100 | #264 | Tragic 14.4% |
| Immigrants | Guyana | 0.1 /100 | #265 | Tragic 14.5% |
| Guyanese | 0.1 /100 | #266 | Tragic 14.5% |
| Iroquois | 0.1 /100 | #267 | Tragic 14.5% |
| Sub-Saharan Africans | 0.1 /100 | #268 | Tragic 14.5% |
| Immigrants | Cuba | 0.1 /100 | #269 | Tragic 14.6% |
| Central Americans | 0.1 /100 | #270 | Tragic 14.6% |
Demographics Similar to Afghans by Poverty
In terms of poverty, the demographic groups most similar to Afghans are Syrian (12.0%, a difference of 0.030%), Immigrants from Bosnia and Herzegovina (12.0%, a difference of 0.16%), Immigrants from Germany (12.0%, a difference of 0.28%), Immigrants from Malaysia (12.0%, a difference of 0.28%), and Immigrants from Kazakhstan (12.0%, a difference of 0.33%).
| Demographics | Rating | Rank | Poverty |
| Pakistanis | 82.2 /100 | #139 | Excellent 11.9% |
| Immigrants | Peru | 81.1 /100 | #140 | Excellent 11.9% |
| Immigrants | France | 80.5 /100 | #141 | Excellent 11.9% |
| Basques | 80.4 /100 | #142 | Excellent 11.9% |
| Brazilians | 79.7 /100 | #143 | Good 11.9% |
| Icelanders | 77.9 /100 | #144 | Good 11.9% |
| Syrians | 75.1 /100 | #145 | Good 12.0% |
| Afghans | 74.9 /100 | #146 | Good 12.0% |
| Immigrants | Bosnia and Herzegovina | 73.7 /100 | #147 | Good 12.0% |
| Immigrants | Germany | 72.7 /100 | #148 | Good 12.0% |
| Immigrants | Malaysia | 72.7 /100 | #149 | Good 12.0% |
| Immigrants | Kazakhstan | 72.3 /100 | #150 | Good 12.0% |
| Samoans | 71.9 /100 | #151 | Good 12.0% |
| Armenians | 67.6 /100 | #152 | Good 12.1% |
| Immigrants | Northern Africa | 63.9 /100 | #153 | Good 12.1% |