Immigrants from Cambodia vs Afghan Poverty
COMPARE
Immigrants from Cambodia
Afghan
Poverty
Poverty Comparison
Immigrants from Cambodia
Afghans
13.4%
POVERTY
3.0/ 100
METRIC RATING
219th/ 347
METRIC RANK
12.0%
POVERTY
74.9/ 100
METRIC RATING
146th/ 347
METRIC RANK
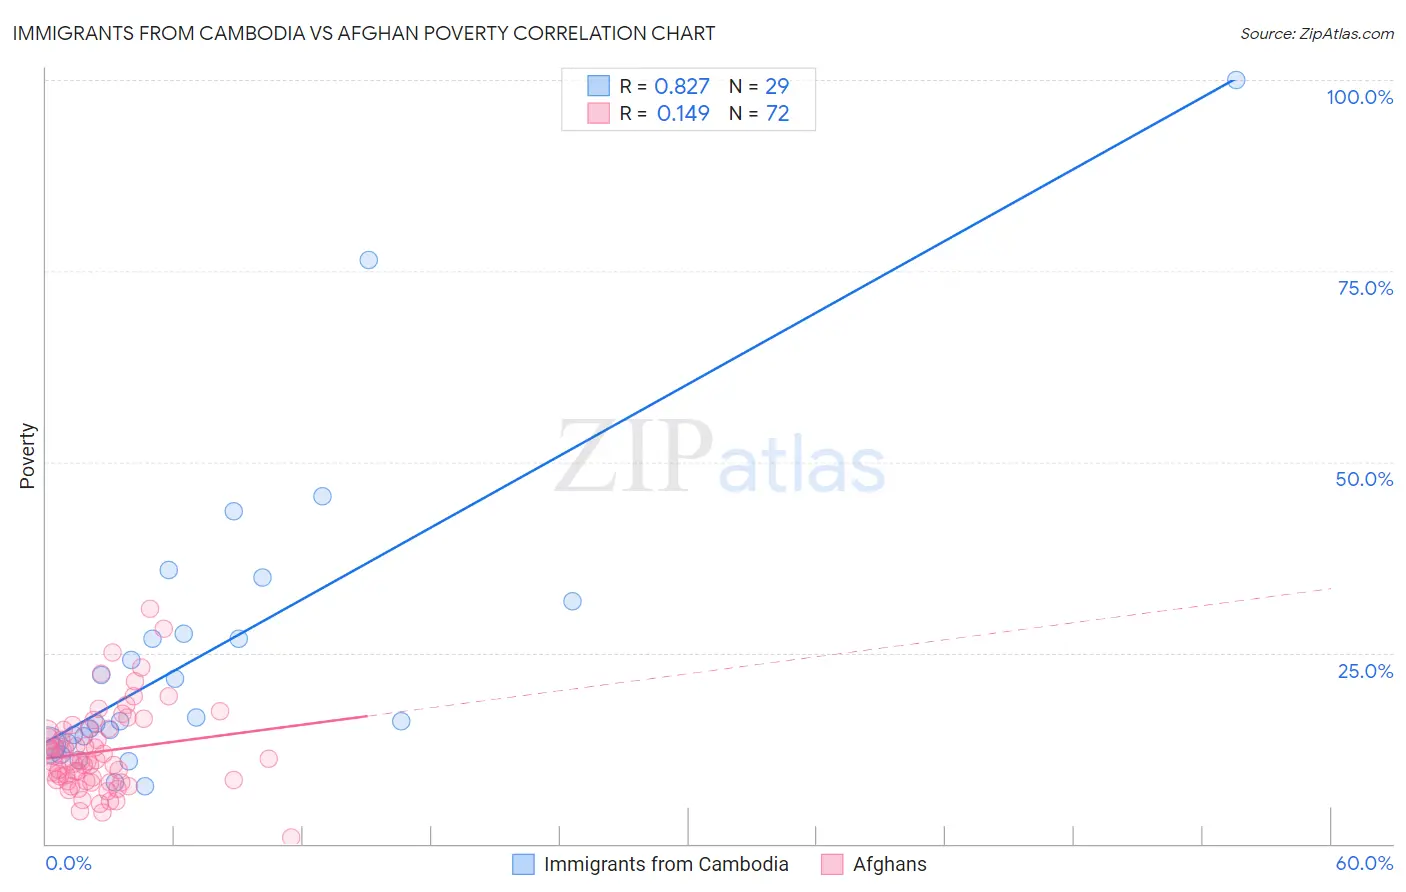
Immigrants from Cambodia vs Afghan Poverty Correlation Chart
The statistical analysis conducted on geographies consisting of 205,130,187 people shows a very strong positive correlation between the proportion of Immigrants from Cambodia and poverty level in the United States with a correlation coefficient (R) of 0.827 and weighted average of 13.4%. Similarly, the statistical analysis conducted on geographies consisting of 148,816,997 people shows a poor positive correlation between the proportion of Afghans and poverty level in the United States with a correlation coefficient (R) of 0.149 and weighted average of 12.0%, a difference of 11.4%.
Poverty Correlation Summary
| Measurement | Immigrants from Cambodia | Afghan |
| Minimum | 7.5% | 0.81% |
| Maximum | 100.0% | 30.8% |
| Range | 92.5% | 30.0% |
| Mean | 25.1% | 12.1% |
| Median | 16.0% | 10.8% |
| Interquartile 25% (IQ1) | 13.1% | 8.2% |
| Interquartile 75% (IQ3) | 29.7% | 14.9% |
| Interquartile Range (IQR) | 16.6% | 6.7% |
| Standard Deviation (Sample) | 20.4% | 5.5% |
| Standard Deviation (Population) | 20.1% | 5.5% |
Similar Demographics by Poverty
Demographics Similar to Immigrants from Cambodia by Poverty
In terms of poverty, the demographic groups most similar to Immigrants from Cambodia are American (13.4%, a difference of 0.090%), Immigrants from Thailand (13.3%, a difference of 0.12%), Immigrants from Uzbekistan (13.3%, a difference of 0.19%), Japanese (13.3%, a difference of 0.23%), and Nonimmigrants (13.3%, a difference of 0.23%).
| Demographics | Rating | Rank | Poverty |
| Immigrants | Immigrants | 4.3 /100 | #212 | Tragic 13.2% |
| Immigrants | Panama | 4.1 /100 | #213 | Tragic 13.3% |
| Bermudans | 3.7 /100 | #214 | Tragic 13.3% |
| Japanese | 3.3 /100 | #215 | Tragic 13.3% |
| Immigrants | Nonimmigrants | 3.3 /100 | #216 | Tragic 13.3% |
| Immigrants | Uzbekistan | 3.2 /100 | #217 | Tragic 13.3% |
| Immigrants | Thailand | 3.1 /100 | #218 | Tragic 13.3% |
| Immigrants | Cambodia | 3.0 /100 | #219 | Tragic 13.4% |
| Americans | 2.9 /100 | #220 | Tragic 13.4% |
| Alsatians | 2.6 /100 | #221 | Tragic 13.4% |
| Immigrants | Micronesia | 2.6 /100 | #222 | Tragic 13.4% |
| Immigrants | Africa | 2.5 /100 | #223 | Tragic 13.4% |
| Immigrants | Eritrea | 2.4 /100 | #224 | Tragic 13.4% |
| German Russians | 2.2 /100 | #225 | Tragic 13.4% |
| Marshallese | 2.2 /100 | #226 | Tragic 13.4% |
Demographics Similar to Afghans by Poverty
In terms of poverty, the demographic groups most similar to Afghans are Syrian (12.0%, a difference of 0.030%), Immigrants from Bosnia and Herzegovina (12.0%, a difference of 0.16%), Immigrants from Germany (12.0%, a difference of 0.28%), Immigrants from Malaysia (12.0%, a difference of 0.28%), and Immigrants from Kazakhstan (12.0%, a difference of 0.33%).
| Demographics | Rating | Rank | Poverty |
| Pakistanis | 82.2 /100 | #139 | Excellent 11.9% |
| Immigrants | Peru | 81.1 /100 | #140 | Excellent 11.9% |
| Immigrants | France | 80.5 /100 | #141 | Excellent 11.9% |
| Basques | 80.4 /100 | #142 | Excellent 11.9% |
| Brazilians | 79.7 /100 | #143 | Good 11.9% |
| Icelanders | 77.9 /100 | #144 | Good 11.9% |
| Syrians | 75.1 /100 | #145 | Good 12.0% |
| Afghans | 74.9 /100 | #146 | Good 12.0% |
| Immigrants | Bosnia and Herzegovina | 73.7 /100 | #147 | Good 12.0% |
| Immigrants | Germany | 72.7 /100 | #148 | Good 12.0% |
| Immigrants | Malaysia | 72.7 /100 | #149 | Good 12.0% |
| Immigrants | Kazakhstan | 72.3 /100 | #150 | Good 12.0% |
| Samoans | 71.9 /100 | #151 | Good 12.0% |
| Armenians | 67.6 /100 | #152 | Good 12.1% |
| Immigrants | Northern Africa | 63.9 /100 | #153 | Good 12.1% |