Immigrants from Northern Europe vs Afghan Poverty
COMPARE
Immigrants from Northern Europe
Afghan
Poverty
Poverty Comparison
Immigrants from Northern Europe
Afghans
10.7%
POVERTY
99.6/ 100
METRIC RATING
27th/ 347
METRIC RANK
12.0%
POVERTY
74.9/ 100
METRIC RATING
146th/ 347
METRIC RANK
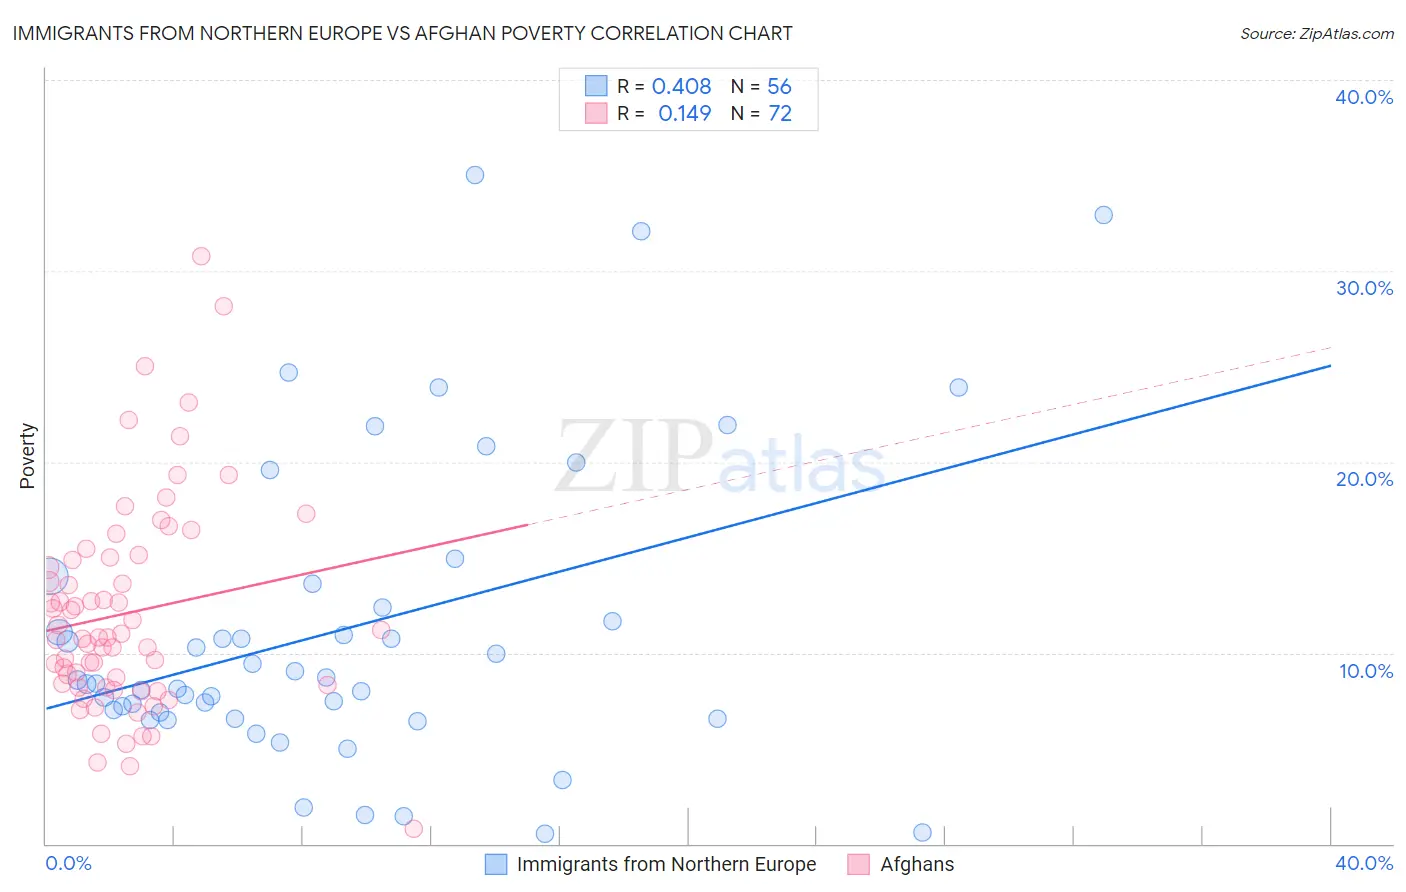
Immigrants from Northern Europe vs Afghan Poverty Correlation Chart
The statistical analysis conducted on geographies consisting of 476,900,751 people shows a moderate positive correlation between the proportion of Immigrants from Northern Europe and poverty level in the United States with a correlation coefficient (R) of 0.408 and weighted average of 10.7%. Similarly, the statistical analysis conducted on geographies consisting of 148,816,997 people shows a poor positive correlation between the proportion of Afghans and poverty level in the United States with a correlation coefficient (R) of 0.149 and weighted average of 12.0%, a difference of 12.0%.
Poverty Correlation Summary
| Measurement | Immigrants from Northern Europe | Afghan |
| Minimum | 0.52% | 0.81% |
| Maximum | 35.0% | 30.8% |
| Range | 34.5% | 30.0% |
| Mean | 11.2% | 12.1% |
| Median | 8.5% | 10.8% |
| Interquartile 25% (IQ1) | 6.7% | 8.2% |
| Interquartile 75% (IQ3) | 13.0% | 14.9% |
| Interquartile Range (IQR) | 6.3% | 6.7% |
| Standard Deviation (Sample) | 7.9% | 5.5% |
| Standard Deviation (Population) | 7.9% | 5.5% |
Similar Demographics by Poverty
Demographics Similar to Immigrants from Northern Europe by Poverty
In terms of poverty, the demographic groups most similar to Immigrants from Northern Europe are Immigrants from Korea (10.7%, a difference of 0.070%), Greek (10.7%, a difference of 0.16%), Danish (10.7%, a difference of 0.17%), Polish (10.7%, a difference of 0.25%), and Iranian (10.7%, a difference of 0.34%).
| Demographics | Rating | Rank | Poverty |
| Immigrants | North Macedonia | 99.7 /100 | #20 | Exceptional 10.6% |
| Luxembourgers | 99.7 /100 | #21 | Exceptional 10.6% |
| Eastern Europeans | 99.7 /100 | #22 | Exceptional 10.6% |
| Swedes | 99.7 /100 | #23 | Exceptional 10.6% |
| Italians | 99.7 /100 | #24 | Exceptional 10.6% |
| Croatians | 99.6 /100 | #25 | Exceptional 10.6% |
| Burmese | 99.6 /100 | #26 | Exceptional 10.7% |
| Immigrants | Northern Europe | 99.6 /100 | #27 | Exceptional 10.7% |
| Immigrants | Korea | 99.5 /100 | #28 | Exceptional 10.7% |
| Greeks | 99.5 /100 | #29 | Exceptional 10.7% |
| Danes | 99.5 /100 | #30 | Exceptional 10.7% |
| Poles | 99.5 /100 | #31 | Exceptional 10.7% |
| Iranians | 99.5 /100 | #32 | Exceptional 10.7% |
| Macedonians | 99.4 /100 | #33 | Exceptional 10.8% |
| Immigrants | Poland | 99.4 /100 | #34 | Exceptional 10.8% |
Demographics Similar to Afghans by Poverty
In terms of poverty, the demographic groups most similar to Afghans are Syrian (12.0%, a difference of 0.030%), Immigrants from Bosnia and Herzegovina (12.0%, a difference of 0.16%), Immigrants from Germany (12.0%, a difference of 0.28%), Immigrants from Malaysia (12.0%, a difference of 0.28%), and Immigrants from Kazakhstan (12.0%, a difference of 0.33%).
| Demographics | Rating | Rank | Poverty |
| Pakistanis | 82.2 /100 | #139 | Excellent 11.9% |
| Immigrants | Peru | 81.1 /100 | #140 | Excellent 11.9% |
| Immigrants | France | 80.5 /100 | #141 | Excellent 11.9% |
| Basques | 80.4 /100 | #142 | Excellent 11.9% |
| Brazilians | 79.7 /100 | #143 | Good 11.9% |
| Icelanders | 77.9 /100 | #144 | Good 11.9% |
| Syrians | 75.1 /100 | #145 | Good 12.0% |
| Afghans | 74.9 /100 | #146 | Good 12.0% |
| Immigrants | Bosnia and Herzegovina | 73.7 /100 | #147 | Good 12.0% |
| Immigrants | Germany | 72.7 /100 | #148 | Good 12.0% |
| Immigrants | Malaysia | 72.7 /100 | #149 | Good 12.0% |
| Immigrants | Kazakhstan | 72.3 /100 | #150 | Good 12.0% |
| Samoans | 71.9 /100 | #151 | Good 12.0% |
| Armenians | 67.6 /100 | #152 | Good 12.1% |
| Immigrants | Northern Africa | 63.9 /100 | #153 | Good 12.1% |