Navajo vs Afghan Poverty
COMPARE
Navajo
Afghan
Poverty
Poverty Comparison
Navajo
Afghans
23.1%
POVERTY
0.0/ 100
METRIC RATING
345th/ 347
METRIC RANK
12.0%
POVERTY
74.9/ 100
METRIC RATING
146th/ 347
METRIC RANK
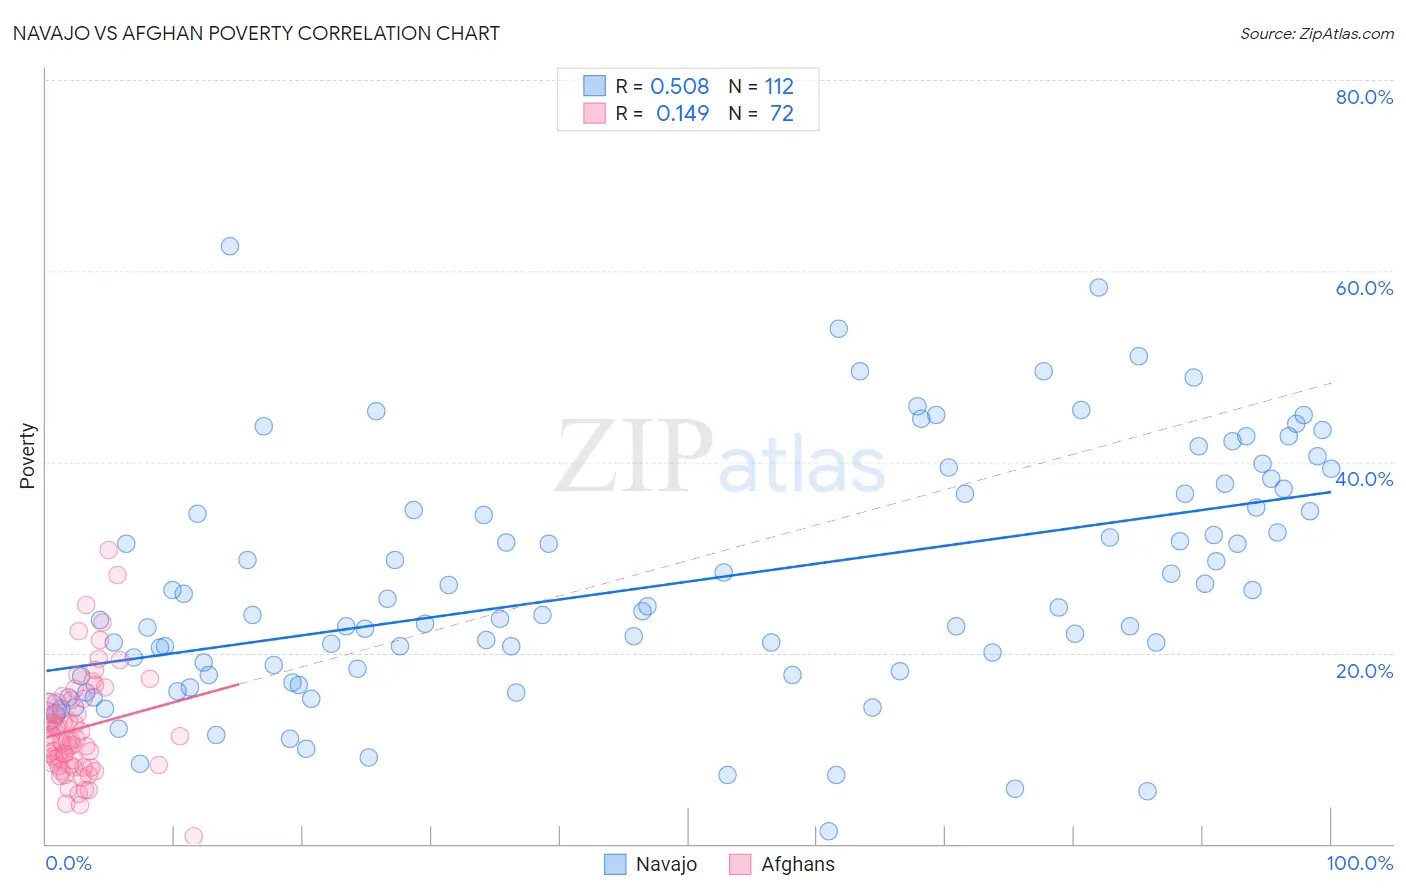
Navajo vs Afghan Poverty Correlation Chart
The statistical analysis conducted on geographies consisting of 224,751,709 people shows a substantial positive correlation between the proportion of Navajo and poverty level in the United States with a correlation coefficient (R) of 0.508 and weighted average of 23.1%. Similarly, the statistical analysis conducted on geographies consisting of 148,816,997 people shows a poor positive correlation between the proportion of Afghans and poverty level in the United States with a correlation coefficient (R) of 0.149 and weighted average of 12.0%, a difference of 92.5%.
Poverty Correlation Summary
| Measurement | Navajo | Afghan |
| Minimum | 1.3% | 0.81% |
| Maximum | 62.6% | 30.8% |
| Range | 61.2% | 30.0% |
| Mean | 27.2% | 12.1% |
| Median | 24.2% | 10.8% |
| Interquartile 25% (IQ1) | 17.7% | 8.2% |
| Interquartile 75% (IQ3) | 36.7% | 14.9% |
| Interquartile Range (IQR) | 19.1% | 6.7% |
| Standard Deviation (Sample) | 12.7% | 5.5% |
| Standard Deviation (Population) | 12.6% | 5.5% |
Similar Demographics by Poverty
Demographics Similar to Navajo by Poverty
In terms of poverty, the demographic groups most similar to Navajo are Puerto Rican (23.7%, a difference of 2.5%), Lumbee (21.9%, a difference of 5.4%), Pima (21.9%, a difference of 5.6%), Tohono O'odham (24.4%, a difference of 5.7%), and Immigrants from Yemen (21.5%, a difference of 7.3%).
| Demographics | Rating | Rank | Poverty |
| Houma | 0.0 /100 | #333 | Tragic 18.4% |
| Apache | 0.0 /100 | #334 | Tragic 18.4% |
| Cheyenne | 0.0 /100 | #335 | Tragic 18.9% |
| Pueblo | 0.0 /100 | #336 | Tragic 19.4% |
| Sioux | 0.0 /100 | #337 | Tragic 19.8% |
| Yuman | 0.0 /100 | #338 | Tragic 20.2% |
| Crow | 0.0 /100 | #339 | Tragic 20.7% |
| Yup'ik | 0.0 /100 | #340 | Tragic 20.8% |
| Hopi | 0.0 /100 | #341 | Tragic 20.8% |
| Immigrants | Yemen | 0.0 /100 | #342 | Tragic 21.5% |
| Pima | 0.0 /100 | #343 | Tragic 21.9% |
| Lumbee | 0.0 /100 | #344 | Tragic 21.9% |
| Navajo | 0.0 /100 | #345 | Tragic 23.1% |
| Puerto Ricans | 0.0 /100 | #346 | Tragic 23.7% |
| Tohono O'odham | 0.0 /100 | #347 | Tragic 24.4% |
Demographics Similar to Afghans by Poverty
In terms of poverty, the demographic groups most similar to Afghans are Syrian (12.0%, a difference of 0.030%), Immigrants from Bosnia and Herzegovina (12.0%, a difference of 0.16%), Immigrants from Germany (12.0%, a difference of 0.28%), Immigrants from Malaysia (12.0%, a difference of 0.28%), and Immigrants from Kazakhstan (12.0%, a difference of 0.33%).
| Demographics | Rating | Rank | Poverty |
| Pakistanis | 82.2 /100 | #139 | Excellent 11.9% |
| Immigrants | Peru | 81.1 /100 | #140 | Excellent 11.9% |
| Immigrants | France | 80.5 /100 | #141 | Excellent 11.9% |
| Basques | 80.4 /100 | #142 | Excellent 11.9% |
| Brazilians | 79.7 /100 | #143 | Good 11.9% |
| Icelanders | 77.9 /100 | #144 | Good 11.9% |
| Syrians | 75.1 /100 | #145 | Good 12.0% |
| Afghans | 74.9 /100 | #146 | Good 12.0% |
| Immigrants | Bosnia and Herzegovina | 73.7 /100 | #147 | Good 12.0% |
| Immigrants | Germany | 72.7 /100 | #148 | Good 12.0% |
| Immigrants | Malaysia | 72.7 /100 | #149 | Good 12.0% |
| Immigrants | Kazakhstan | 72.3 /100 | #150 | Good 12.0% |
| Samoans | 71.9 /100 | #151 | Good 12.0% |
| Armenians | 67.6 /100 | #152 | Good 12.1% |
| Immigrants | Northern Africa | 63.9 /100 | #153 | Good 12.1% |