Lumbee vs Seminole Poverty
COMPARE
Lumbee
Seminole
Poverty
Poverty Comparison
Lumbee
Seminole
21.9%
POVERTY
0.0/ 100
METRIC RATING
344th/ 347
METRIC RANK
15.6%
POVERTY
0.0/ 100
METRIC RATING
309th/ 347
METRIC RANK
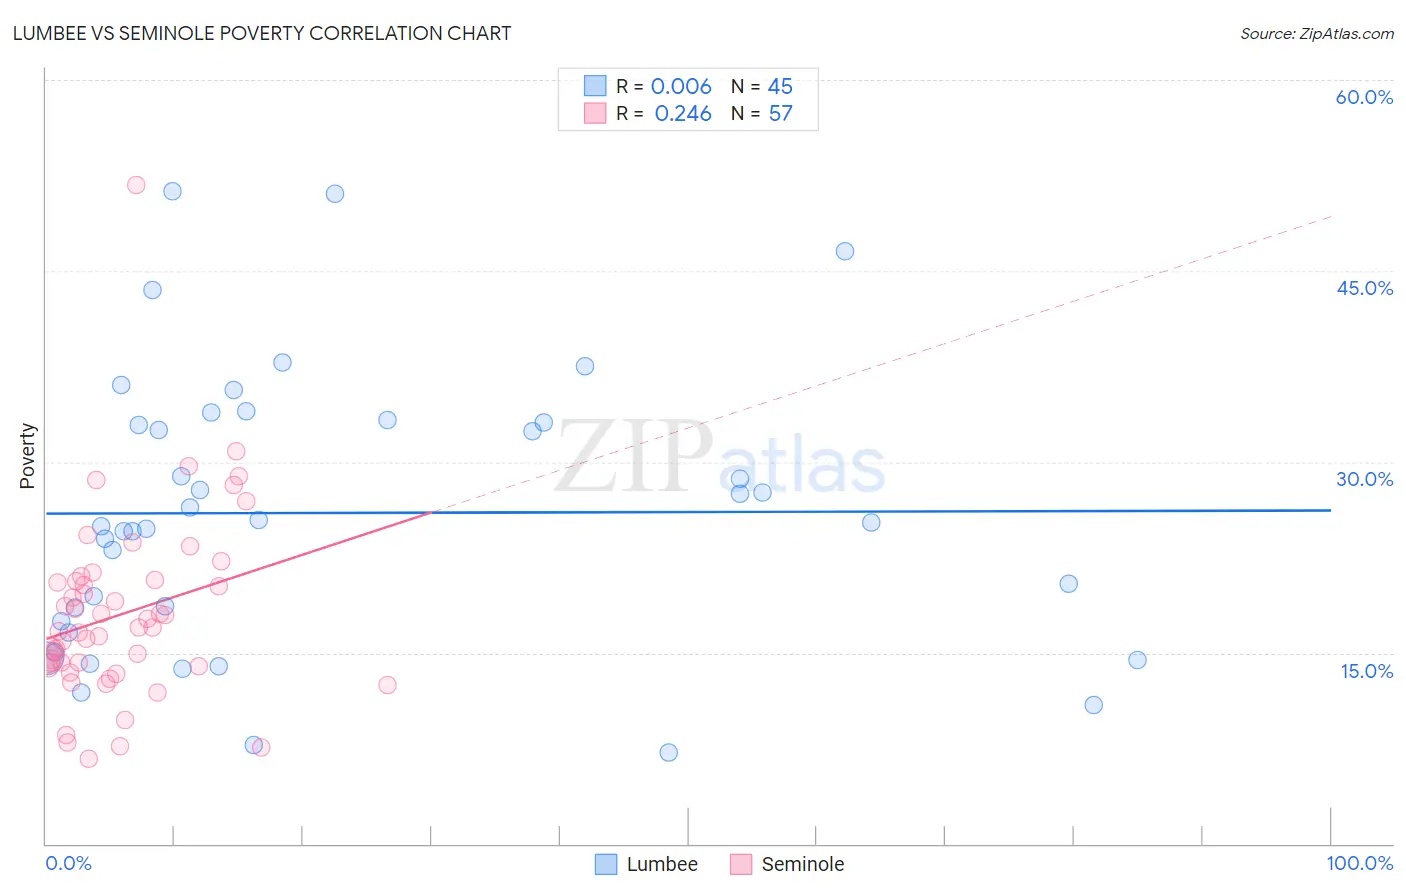
Lumbee vs Seminole Poverty Correlation Chart
The statistical analysis conducted on geographies consisting of 92,257,257 people shows no correlation between the proportion of Lumbee and poverty level in the United States with a correlation coefficient (R) of 0.006 and weighted average of 21.9%. Similarly, the statistical analysis conducted on geographies consisting of 118,300,623 people shows a weak positive correlation between the proportion of Seminole and poverty level in the United States with a correlation coefficient (R) of 0.246 and weighted average of 15.6%, a difference of 40.4%.
Poverty Correlation Summary
| Measurement | Lumbee | Seminole |
| Minimum | 7.2% | 6.7% |
| Maximum | 51.2% | 51.8% |
| Range | 44.0% | 45.1% |
| Mean | 26.0% | 18.0% |
| Median | 25.2% | 16.9% |
| Interquartile 25% (IQ1) | 17.0% | 13.9% |
| Interquartile 75% (IQ3) | 33.2% | 20.7% |
| Interquartile Range (IQR) | 16.2% | 6.8% |
| Standard Deviation (Sample) | 10.8% | 7.3% |
| Standard Deviation (Population) | 10.7% | 7.2% |
Similar Demographics by Poverty
Demographics Similar to Lumbee by Poverty
In terms of poverty, the demographic groups most similar to Lumbee are Pima (21.9%, a difference of 0.26%), Immigrants from Yemen (21.5%, a difference of 1.9%), Hopi (20.8%, a difference of 5.1%), Yup'ik (20.8%, a difference of 5.3%), and Navajo (23.1%, a difference of 5.4%).
| Demographics | Rating | Rank | Poverty |
| Houma | 0.0 /100 | #333 | Tragic 18.4% |
| Apache | 0.0 /100 | #334 | Tragic 18.4% |
| Cheyenne | 0.0 /100 | #335 | Tragic 18.9% |
| Pueblo | 0.0 /100 | #336 | Tragic 19.4% |
| Sioux | 0.0 /100 | #337 | Tragic 19.8% |
| Yuman | 0.0 /100 | #338 | Tragic 20.2% |
| Crow | 0.0 /100 | #339 | Tragic 20.7% |
| Yup'ik | 0.0 /100 | #340 | Tragic 20.8% |
| Hopi | 0.0 /100 | #341 | Tragic 20.8% |
| Immigrants | Yemen | 0.0 /100 | #342 | Tragic 21.5% |
| Pima | 0.0 /100 | #343 | Tragic 21.9% |
| Lumbee | 0.0 /100 | #344 | Tragic 21.9% |
| Navajo | 0.0 /100 | #345 | Tragic 23.1% |
| Puerto Ricans | 0.0 /100 | #346 | Tragic 23.7% |
| Tohono O'odham | 0.0 /100 | #347 | Tragic 24.4% |
Demographics Similar to Seminole by Poverty
In terms of poverty, the demographic groups most similar to Seminole are Choctaw (15.6%, a difference of 0.040%), Dutch West Indian (15.6%, a difference of 0.090%), African (15.6%, a difference of 0.15%), Creek (15.6%, a difference of 0.23%), and Chippewa (15.7%, a difference of 0.48%).
| Demographics | Rating | Rank | Poverty |
| Somalis | 0.0 /100 | #302 | Tragic 15.4% |
| Immigrants | Caribbean | 0.0 /100 | #303 | Tragic 15.5% |
| Immigrants | Mexico | 0.0 /100 | #304 | Tragic 15.5% |
| Immigrants | Guatemala | 0.0 /100 | #305 | Tragic 15.5% |
| Creek | 0.0 /100 | #306 | Tragic 15.6% |
| Africans | 0.0 /100 | #307 | Tragic 15.6% |
| Choctaw | 0.0 /100 | #308 | Tragic 15.6% |
| Seminole | 0.0 /100 | #309 | Tragic 15.6% |
| Dutch West Indians | 0.0 /100 | #310 | Tragic 15.6% |
| Chippewa | 0.0 /100 | #311 | Tragic 15.7% |
| Cajuns | 0.0 /100 | #312 | Tragic 15.7% |
| Immigrants | Grenada | 0.0 /100 | #313 | Tragic 15.8% |
| Immigrants | Somalia | 0.0 /100 | #314 | Tragic 15.8% |
| British West Indians | 0.0 /100 | #315 | Tragic 15.9% |
| Hondurans | 0.0 /100 | #316 | Tragic 15.9% |